
.svg)


How to Set Up the Activity Log Webhook in Lucidya
Learn how to configure the Activity Log Webhook in Lucidya to automatically stream user activity logs to an external SIEM system like Splunk in near real time.
The Activity Log Webhook lets Lucidya automatically push user activity logs to an external endpoint in near real-time. Instead of manually checking the Activity Log inside the platform, you can stream all logged events directly to your SIEM system (such as Splunk) for centralized security monitoring and compliance.
Before You Start
You need Manager permission under General Settings in Lucidya. You also need a valid endpoint URL from your SIEM system and a defined authentication method (header, body, or both) ready before starting the configuration.
Step 1. Navigate to the Webhook Configuration
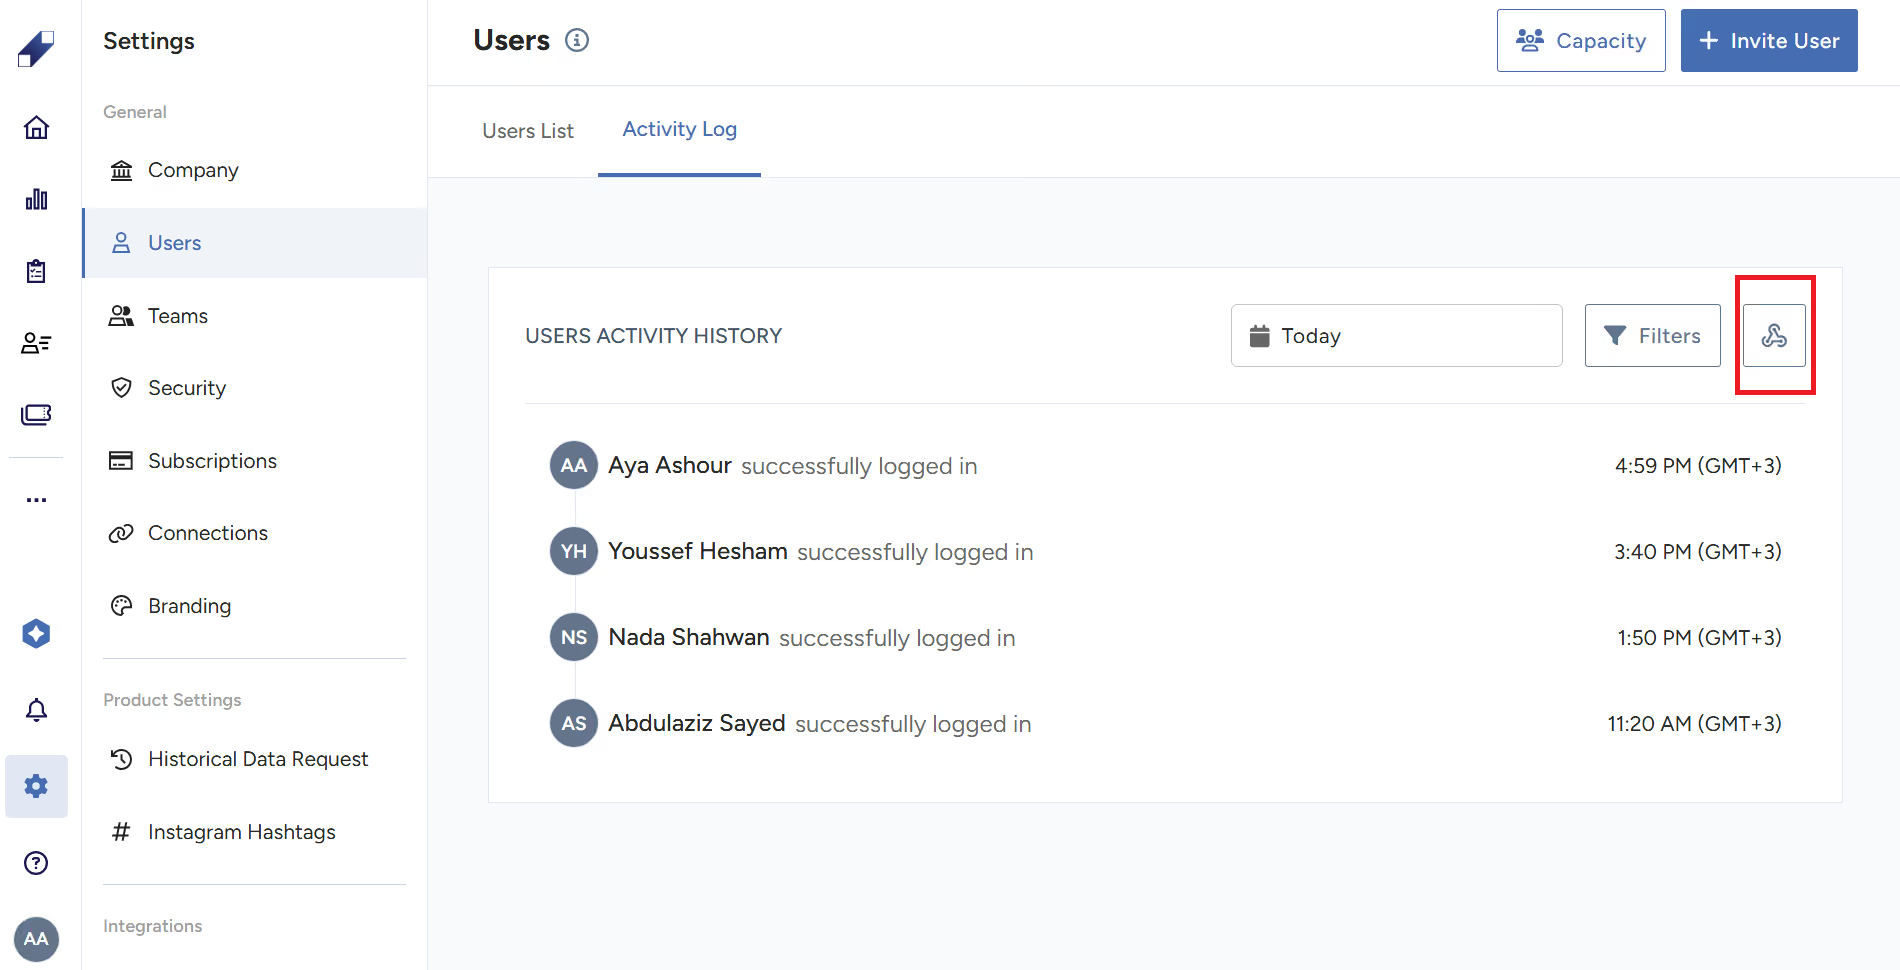
Go to Settings then Users then Activity Log. Click the Webhook Configuration icon.
Step 2. Configure the Webhook
Fill in the following fields.
Method: select the HTTP method for your endpoint. HTTP POST is recommended. HTTP GET is also supported.
URL: enter your SIEM endpoint URL. It must be a valid and reachable URL.
Authentication Variable Name: enter a name for the authentication variable. It must start with a letter, contain only letters and numbers, and contain no spaces. Example: authorization.
Authentication Location: choose where the authentication token is sent: Header, Body, or Both.
Authentication Token: enter your secure token. Arabic characters and special characters are not supported.
Enable the Webhook: toggle to Enable to activate log delivery.
Log Data Structure
All logs are delivered in JSON format. Each payload includes the following fields.
timestamp: UTC time the action occurred.
activity_log: description of the activity performed.
user_action: action type: Read, Create, Update, or Delete.
feature: the platform module where the action took place.
user_email: email address of the user who performed the action.
user_ip_address: IP address of the user.
user_agent: browser or device information.
Here is a sample upload:
{
"timestamp": "2026-03-16T11:10:54Z",
"activity_log": "User A updated permissions for User B",
"user_action": "Update",
"feature": "User Management",
"user_email": "user@company.com",
"user_ip_address": "192.168.1.1",
"user_agent": "Mozilla/5.0"
}
What Events the Webhook Captures
The webhook captures all platform activity, including general actions (viewing data, creating resources, updating configurations, deleting resources) and user management actions (user invitations including the inviter, permission changes, user profile updates, and user deletions).
Managing the Webhook
Users with the Manager role under General Settings can create, edit, enable, disable, and delete the webhook.
Disabling the webhook stops log delivery immediately. Re-enabling it resumes delivery. All webhook-related actions (created, edited, enabled, disabled, deleted) are recorded in the Activity Log.
Security
The authentication token is stored encrypted and masked after saving. You can update or replace the token at any time.
For further assistance contact Lucidya Support.
Frequently asked questions
The Activity Log is the in-platform interface where administrators view user actions directly inside Lucidya. The Activity Log Webhook streams the same data to an external system automatically in near real-time, so it can be integrated into your existing security monitoring and compliance workflows.
All logs are sent in JSON format. Each payload contains the timestamp, activity description, action type, platform module, user email, IP address, and browser information.
Logs that cannot be delivered will not reach your SIEM. Confirm the webhook is enabled, verify the endpoint URL is correct and reachable, and check your authentication configuration if logs are not being received.
Yes. It is recommended to test with a staging endpoint first before pointing the webhook at your production SIEM system.
HTTP POST is recommended for better payload handling. HTTP GET is supported but may have limitations depending on your endpoint configuration.
Yes. All webhook-related actions, including creation, edits, enabling, disabling, and deletion — are recorded in the Activity Log inside Lucidya.
Only users with the Manager role under General Settings can create, edit, enable, disable, or delete the webhook.