
.svg)


How to Analyze Survey Results in Lucidya
Learn how to use the Insights Page in Lucidya Surveys to analyze responses, AI-powered sentiment, dialect detection, NPS, CSAT, geographic data, and per-question statistics.
Lucidya provides a comprehensive Insights Page for every published survey. It updates in real time as new responses come in and covers everything from high-level performance metrics to detailed question-level responses, sentiment analysis, and geographic data.
How to Access the Insights Page
Go to Surveys from the Lucidya navigation bar. Select the survey you want to analyze. Click directly on the survey or click the Insights icon on the survey card.
Overview Section
The Overview section gives you a high-level snapshot of survey performance.
Responses — total number of participants who answered and submitted the survey.
Views — total number of participants who opened or viewed the survey.
Net Sentiment — overall sentiment of free text responses, shown as Positive, Neutral, or Negative.
Completion Rate — total responses divided by total views multiplied by 100.
Average Time to Complete — the average time from opening the survey to submitting it, shown in minutes and seconds.

Metrics Section
The Metrics section contains AI-powered analytics for your survey. Each chart only displays data when the relevant question types are present and have been answered.
Completion Rate Per Question — a column chart showing the completion rate percentage for each question. Calculated by dividing the number of people who completed each question by the total number of visitors and multiplying by 100. Applies to all question types.

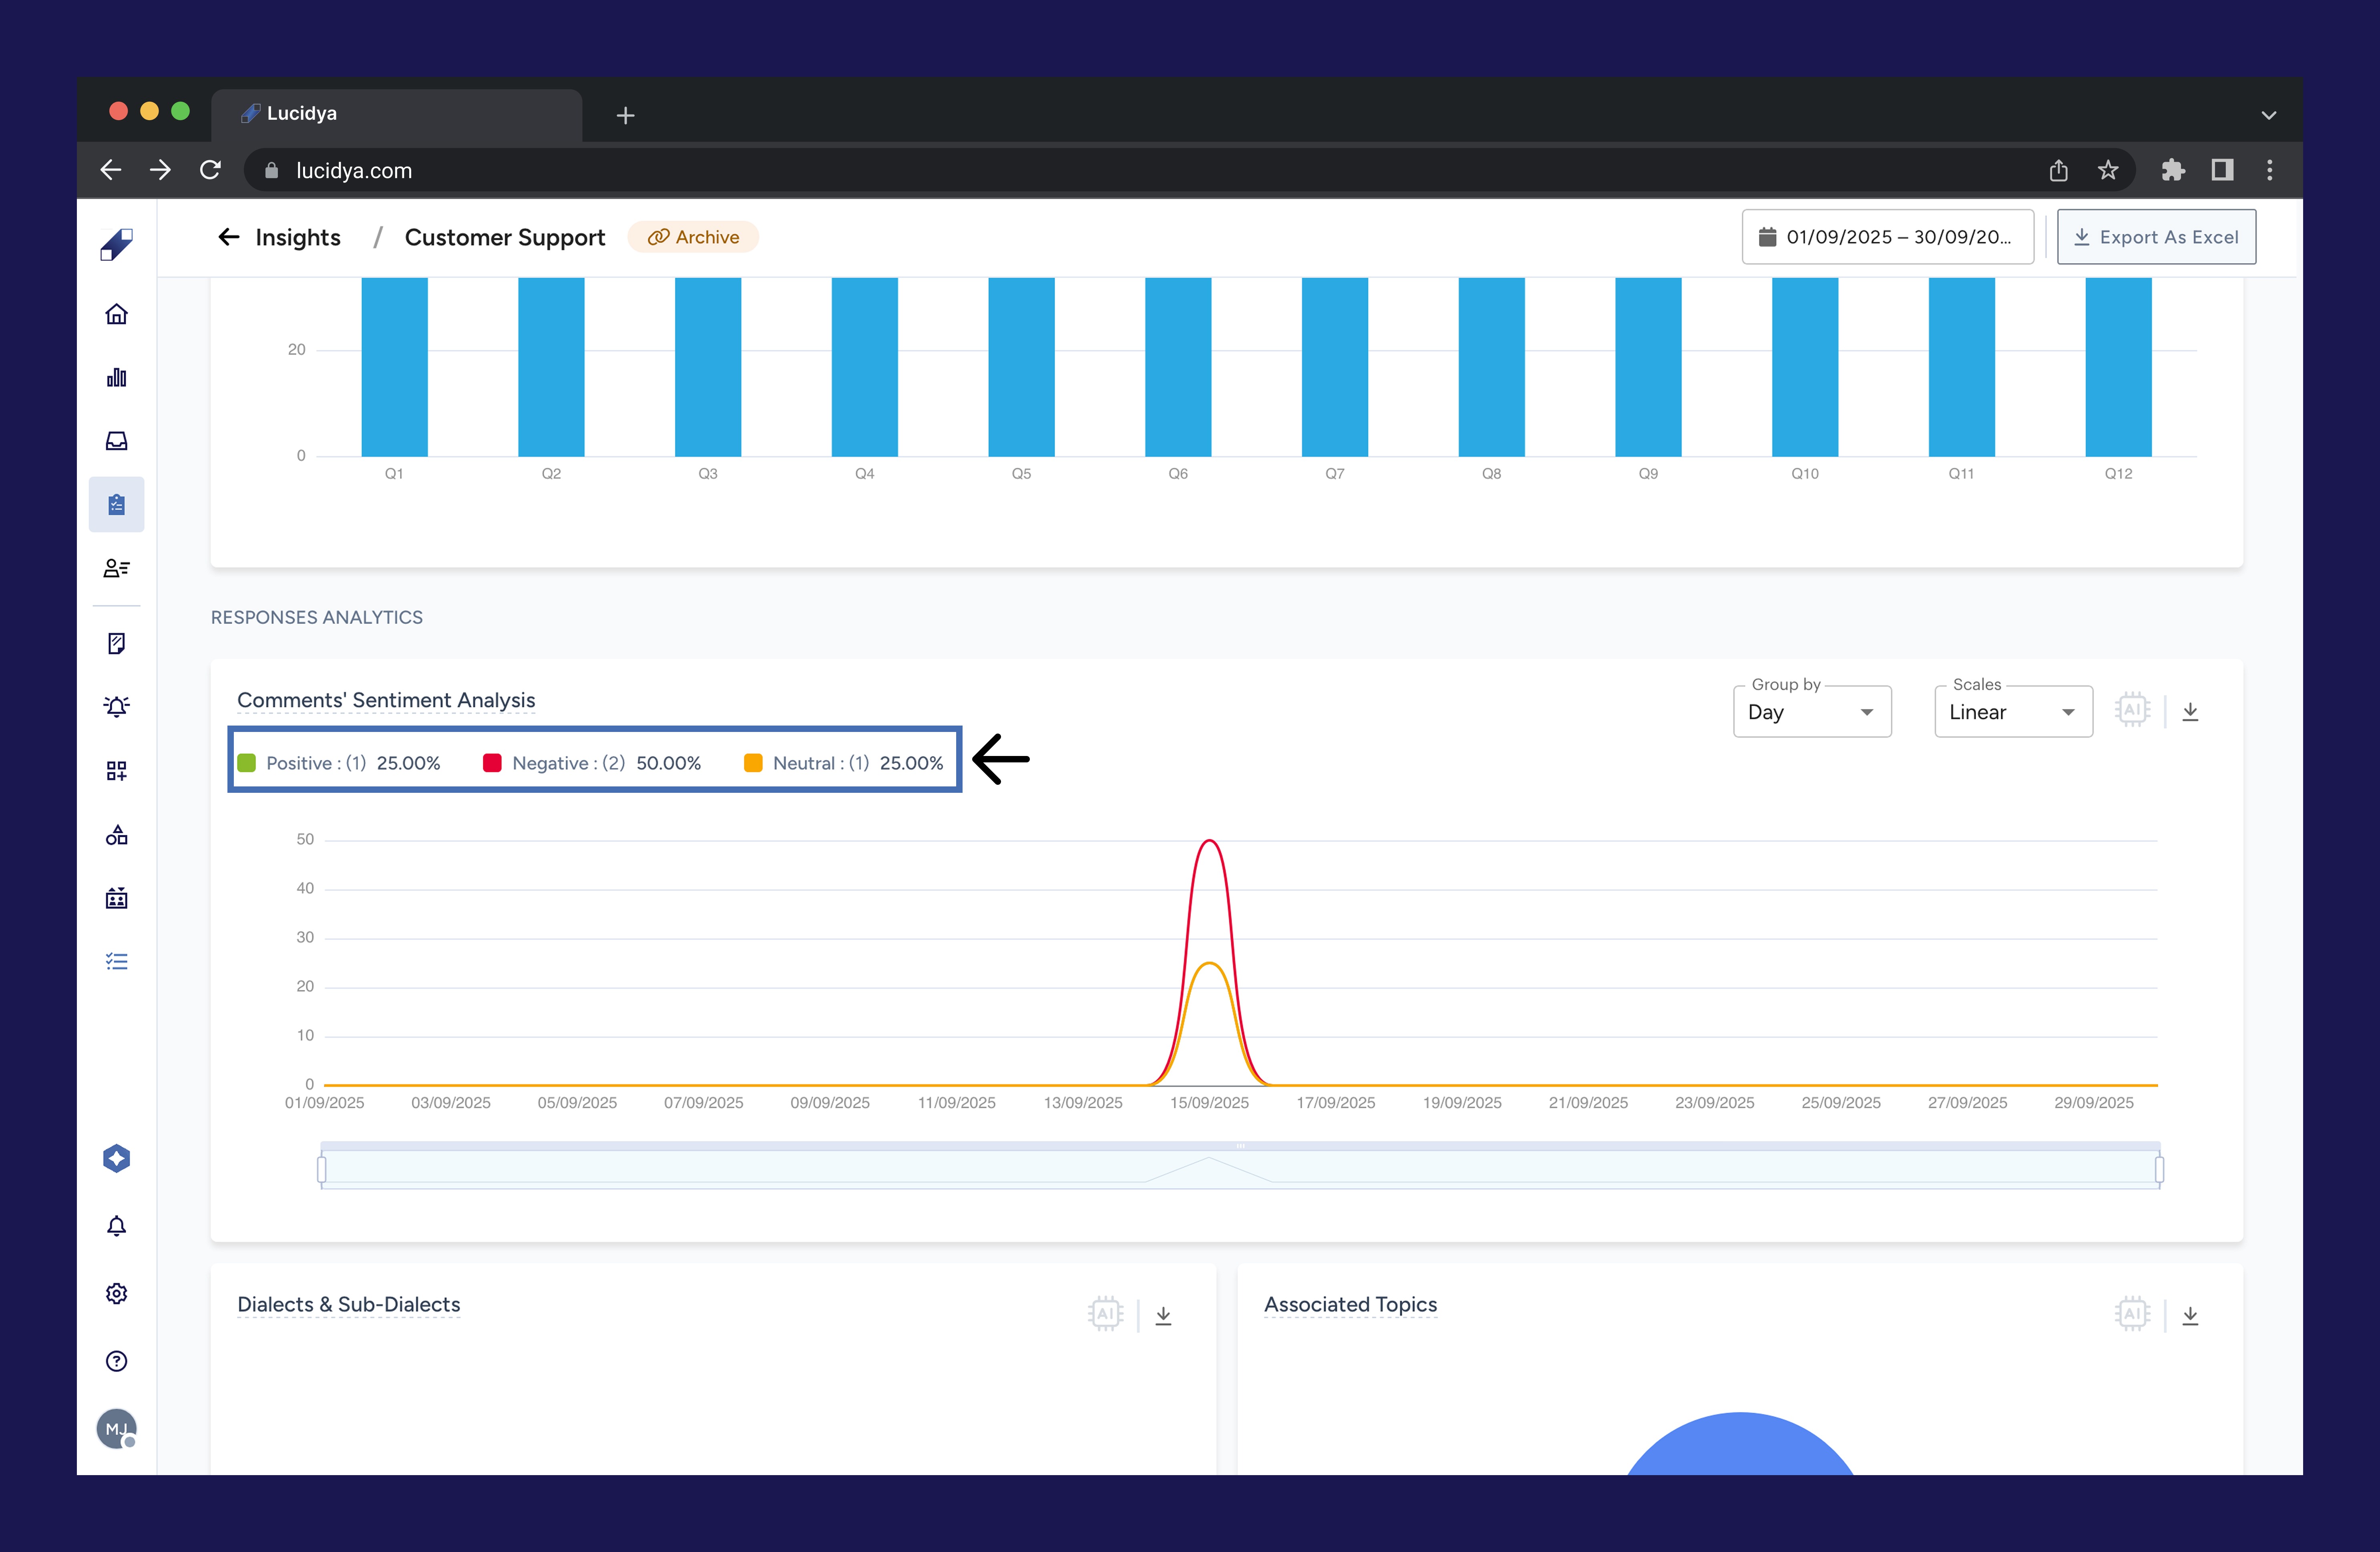
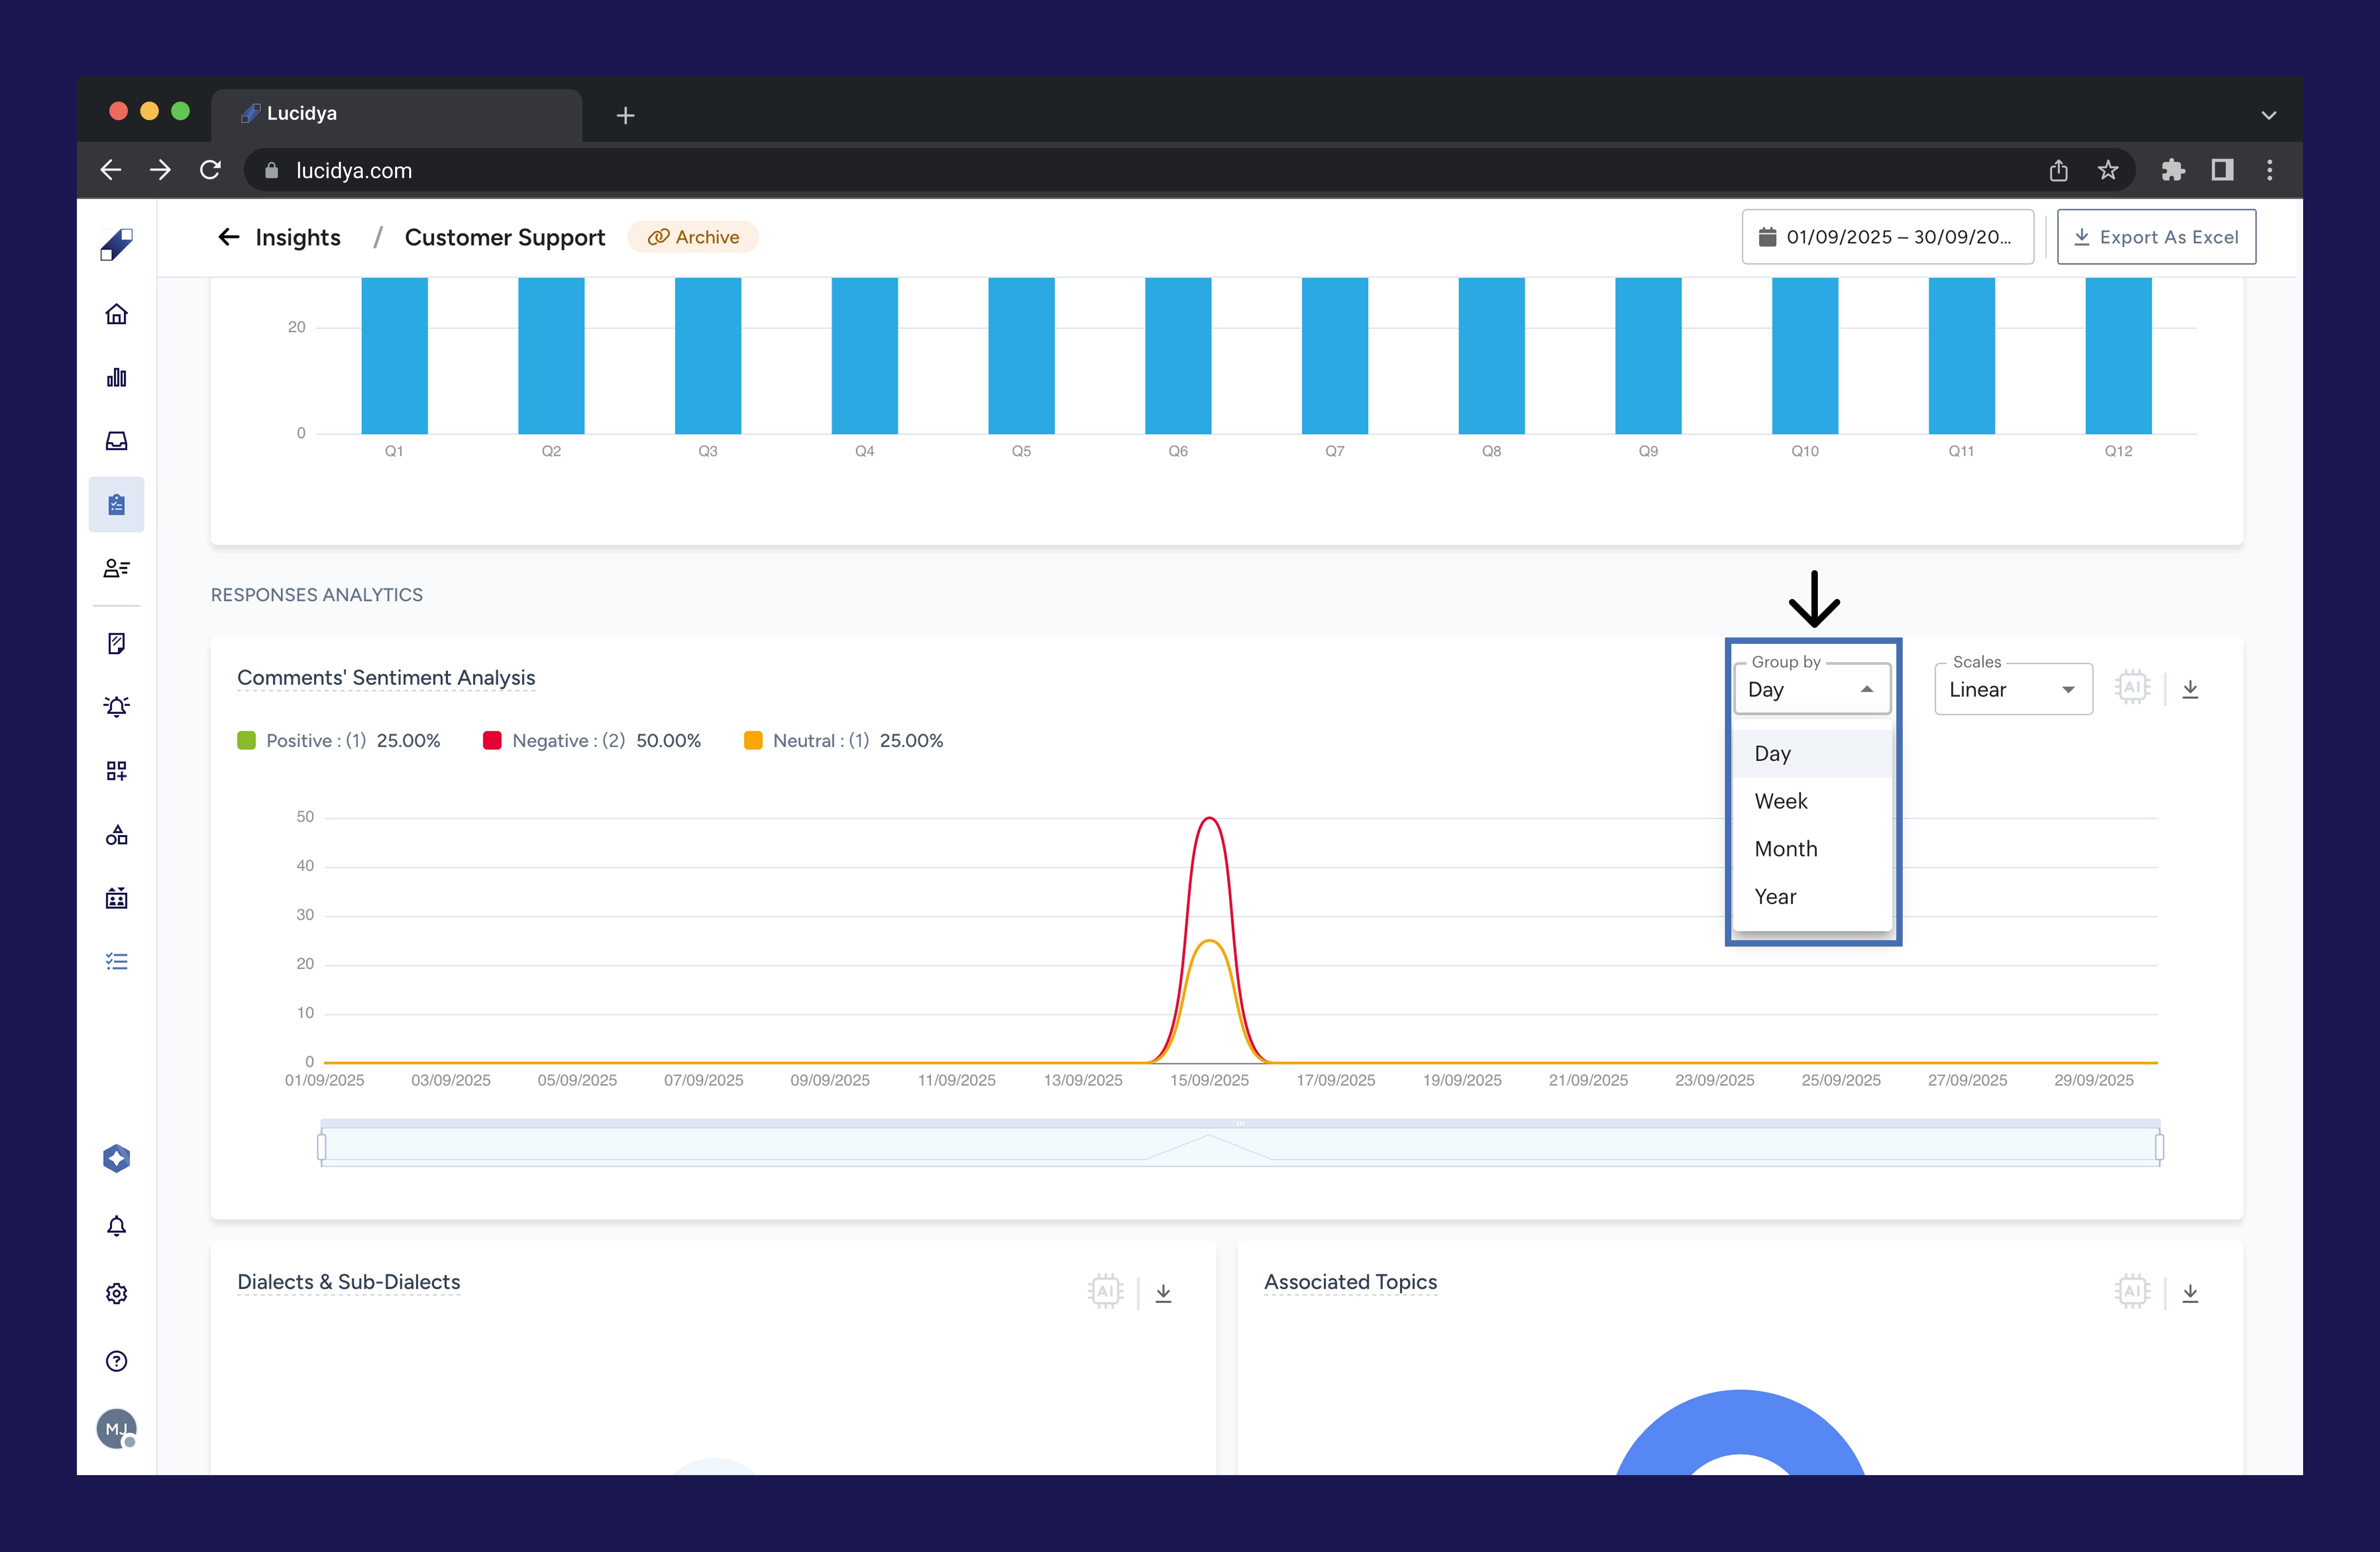
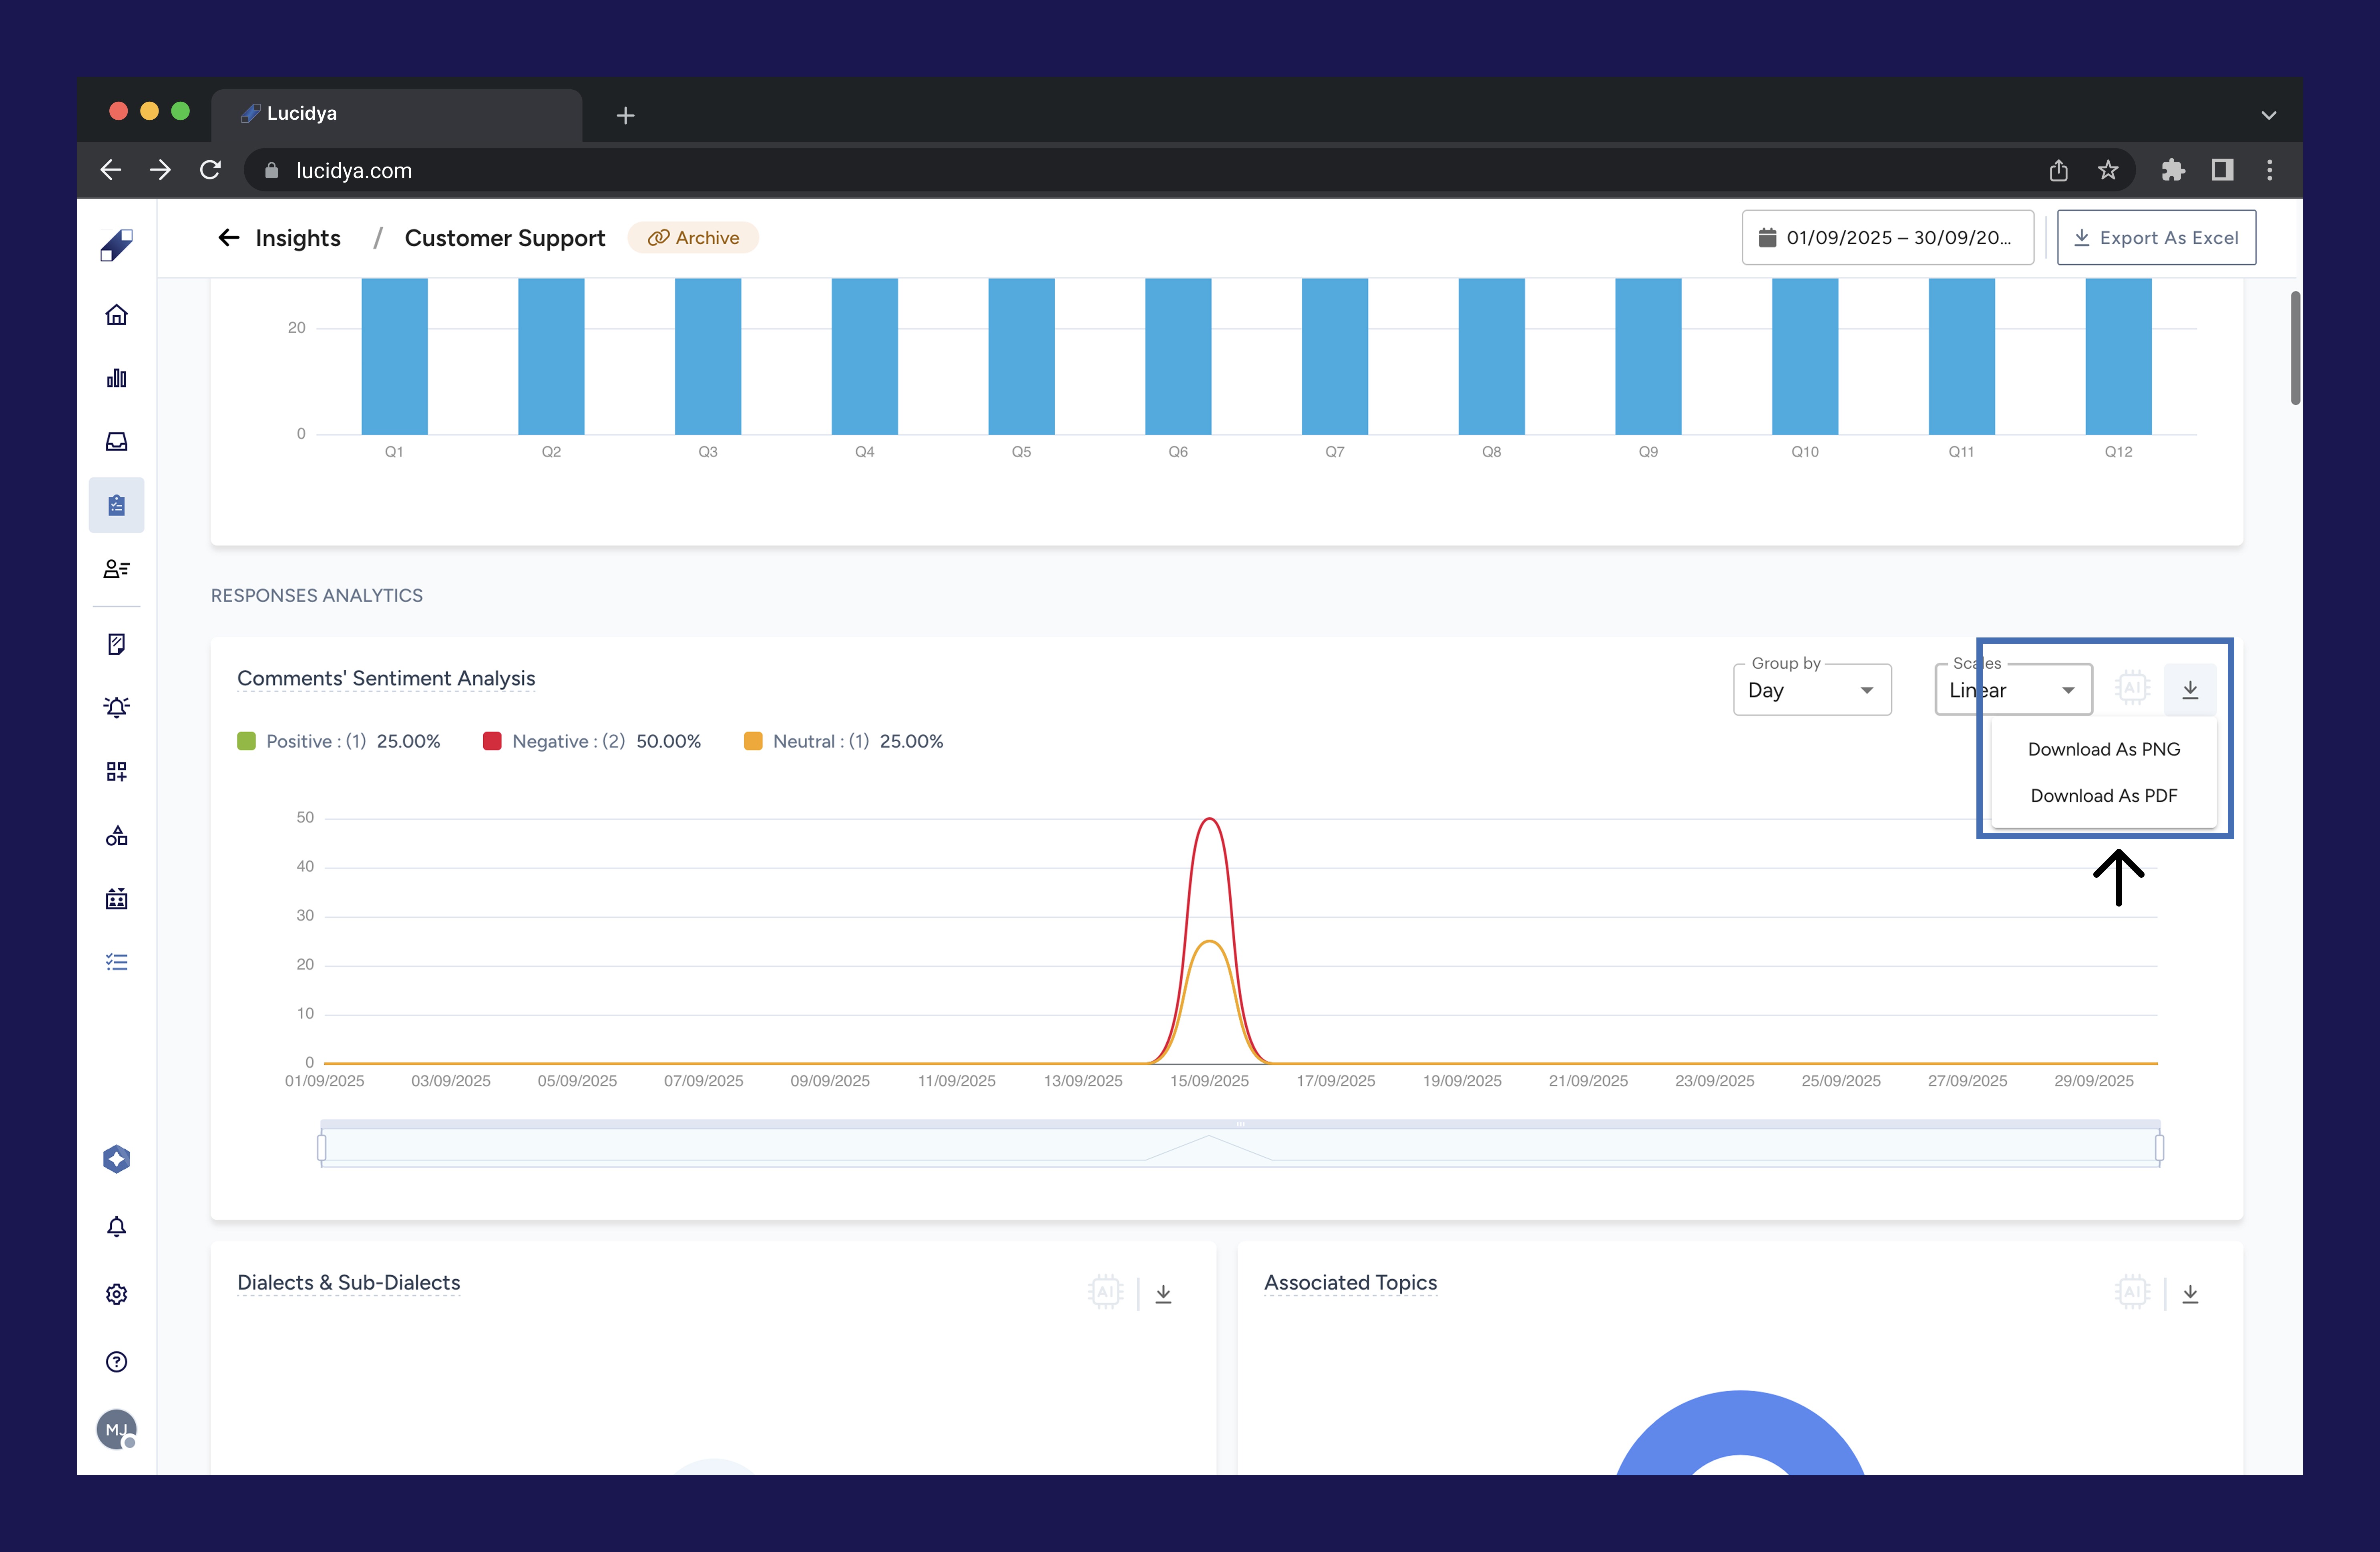
Free Text Sentiment Analysis — a linear or logarithmic graph showing sentiment in free text responses. Breaks down responses into Positive, Neutral, and Negative with counts and percentages. The graph supports the following options: filter by time period (Day, Week, Month, or Year), switch between Linear and Logarithmic graph views, export the graph as PNG or PDF, and toggle the visibility of individual sentiment types. Only displays when free text questions have been answered.
Lucidya's sentiment analysis supports Arabic including over 15 dialects, English, and mixed language responses including Arabic-English code-switching which is common in the MENA region. Sentiment analysis results update in real time as new responses come in. Historical sentiment data is preserved when AI models are updated and can be reprocessed with the latest model for more accurate insights.


Dialects and Sub-dialects — a column chart showing the distribution of free text responses by dialect, including Modern Standard Arabic, Modern Arabic, Saudi, Egyptian, Kuwaiti, and other Arabic dialects detected by Lucidya's AI. Only displays when free text questions have been answered.

Associated Topics — a circular chart distributing free text responses across ten topic domains: Politics, Technology, Food and Drinks, Finance and Business, Entertainment, Fitness, Health, Beauty, Shopping and Fashion, and Other. A single response may be classified into multiple domains so the total may exceed the total response count. Only displays when free text questions have been answered.

Themes and Categories — a column chart categorizing free text responses into Compliment, Complaint, and Other. Themes are configurable and can be added under Themes in Lucidya Settings. Only displays when free text questions have been answered.

Themes and Categories Trend — a column chart showing how Compliments, Complaints, Questions, and Other feedback change over the survey period. Helps identify patterns in customer sentiment over time. Only displays when free text questions have been answered.

Net Promoter Score — a circular chart showing the NPS breakdown across Promoters (9 to 10), Passives (7 to 8), and Detractors (0 to 6). NPS is calculated by subtracting the percentage of Detractors from the percentage of Promoters. Only displays when an NPS question has been answered.

Customer Satisfaction Score — a circular chart showing the CSAT score percentage, calculated by dividing the sum of positive ratings by the total number of responses and multiplying by 100. Only displays when a CSAT question has been answered.

Response Details Section
This section is available for all surveys and provides geographic and technical data about your respondents.
Geographic Data — two circular charts showing the distribution of responses by city and by country. Note that the total number of city or country-tagged responses may be less than the overall response count since not all submissions can be associated with a specific location.

Technical Data — two circular charts showing the browser distribution (Chrome, Safari, Firefox, and others) and operating system distribution (Windows, macOS, iOS, Android, and others) of respondents.

Question Statistics Section
This section provides detailed data for every question in your survey across three tabs.
Summary — grouped responses for each question shown as charts for Dropdown, Yes or No, Multiple Choice, NPS, CSAT, and Rating Scale question types.

Questions — select a specific question from a dropdown menu to view all responses for that question individually.

Individual — a list of individual responses from each person who completed the survey.

Exporting and Filtering Data
To export data, you can export all insights as an Excel file or export any individual chart or graph as a PDF or PNG file. Exported files are sent directly to your email.
To filter data, you can apply a date filter to the entire insights page or apply a date filter to individual charts and graphs.
For further assistance contact Lucidya Support.
Frequently asked questions
Survey insights update in real time as new responses come in. You will see the latest data each time you view the page.
You can view insights with any number of responses. For statistically significant results, particularly for sentiment analysis and theme categorization, a minimum of 30 responses is recommended.
Lucidya's sentiment analysis is highly accurate for Arabic including over 15 dialects, and for English. The AI models are trained on large Arabic language datasets and understand various dialects, slang, and cultural nuances. Mixed language responses including Arabic-English code-switching are also supported.
Yes. The system effectively analyzes sentiment in responses containing mixed languages, particularly Arabic-English combinations common in the MENA region.
Yes. You can filter responses by positive, neutral, or negative sentiment to focus on specific segments. This feature is available in the data exploration section of your dashboard.
Yes. Invite team members to your Lucidya workspace with the appropriate permissions, or export reports as PDFs or Excel files to share externally.
The standard three categories are positive, neutral, and negative. Enterprise users can work with Lucidya's team to customize sentiment thresholds or add subcategories based on specific business needs.
Yes. All historical sentiment data is preserved when AI models are updated. You also have the option to reprocess historical data with the latest model for more accurate insights.