
.svg)


How to Create and Manage Dashboards in Lucidya
Learn how to create Aggregate and Custom Dashboards in Lucidya, plus how to view, edit, delete, and manage the monitors and accounts within them.
Lucidya offers two dashboard types for visualizing data sources: Aggregate Dashboard and Custom Dashboard. Both are created from the same starting point with a shared first step. Once created, you can view, edit, or delete a dashboard, and manage which monitors and accounts it displays.
Before You Start
Only users with permissions to create, edit, pause, resume, and delete dashboards can access dashboard management. View-only users can view dashboards but cannot create or edit them.
Creating a Dashboard
Step 1. Enter Dashboard Information
- Navigate to Dashboards from the left sidebar.
- Click + New Dashboard.
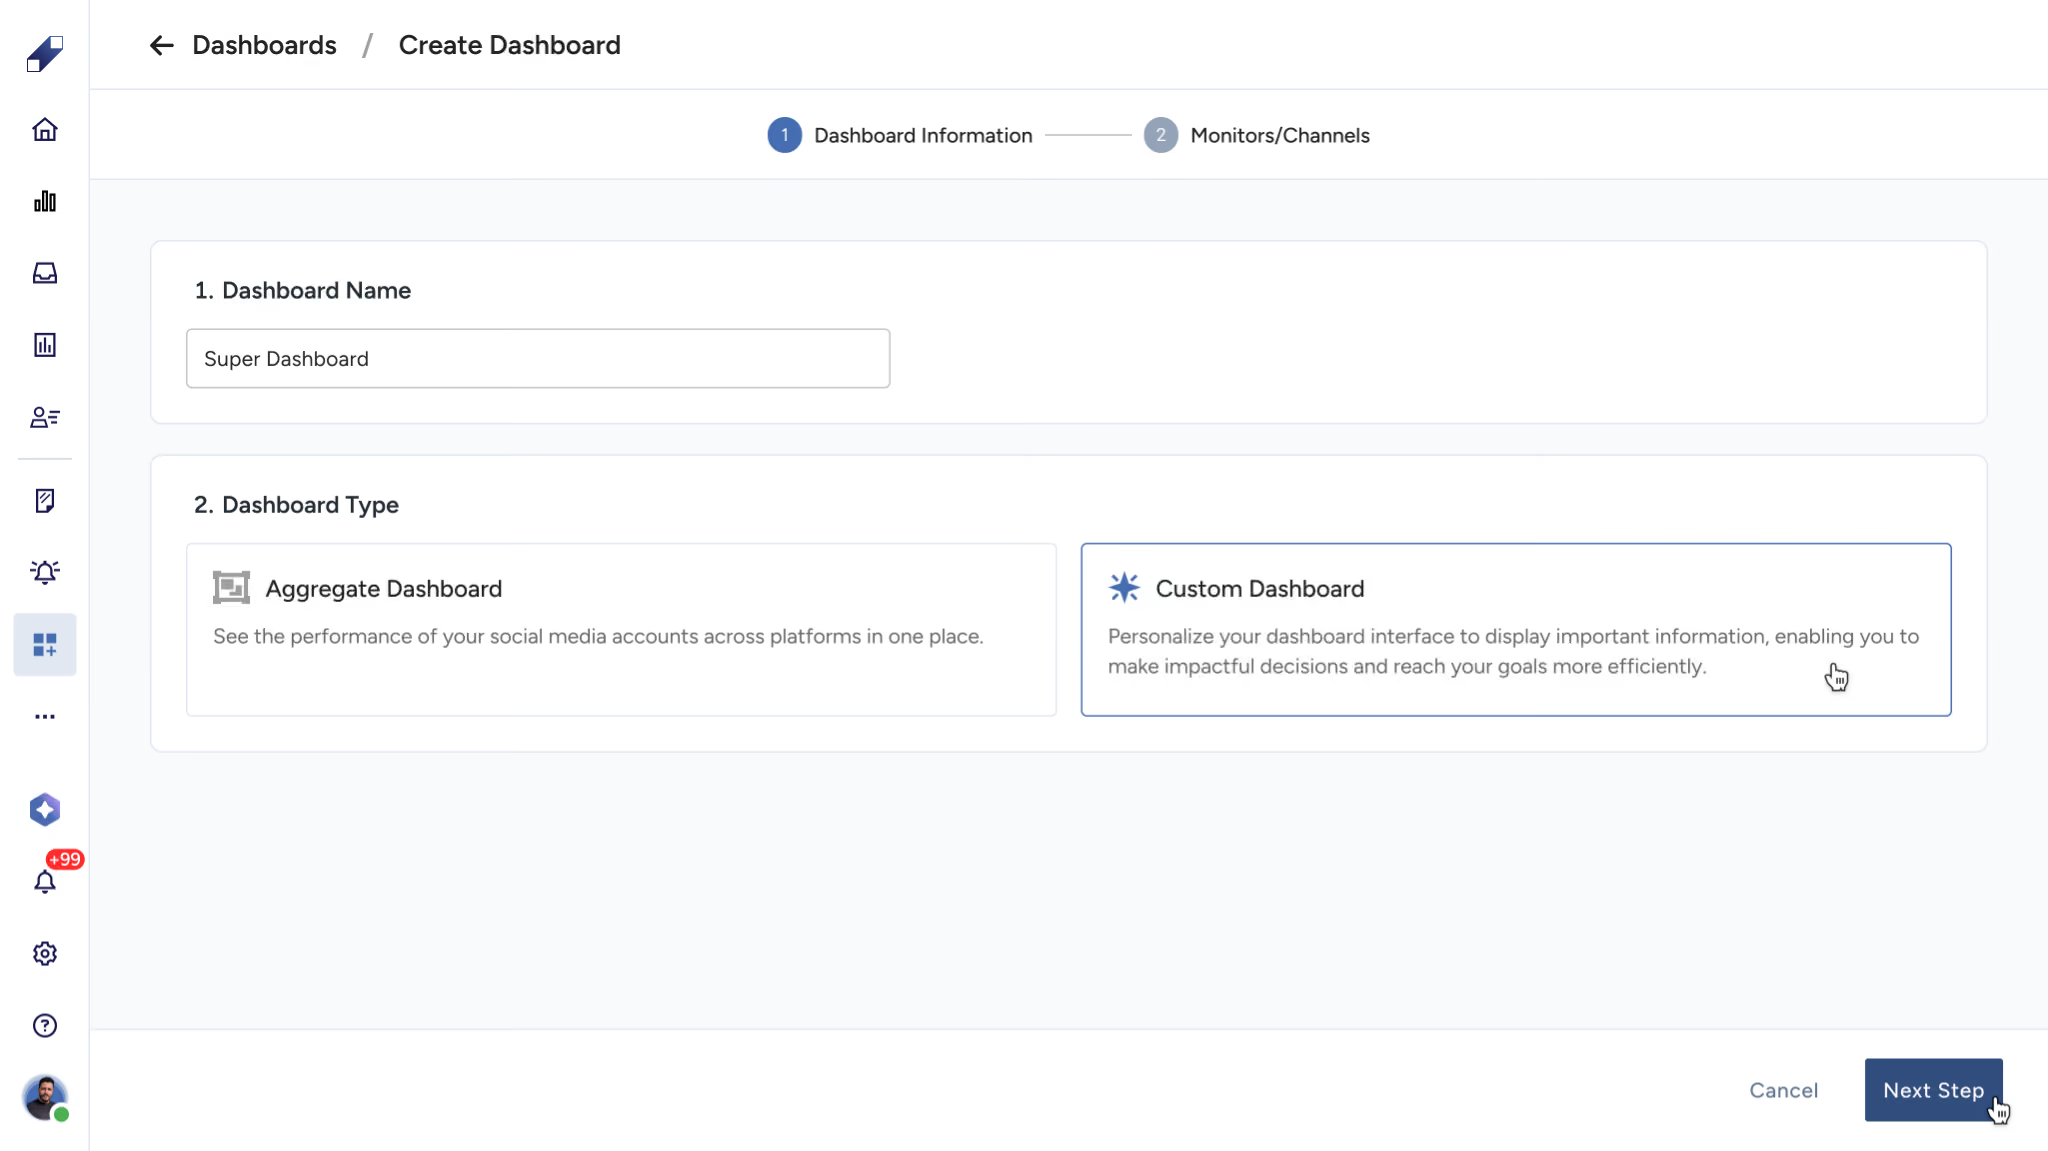
- Enter a Dashboard Name (required).
- Select a Dashboard Type:
- Aggregate Dashboard — combines data from multiple monitors into a unified view.
- Custom Dashboard — lets you select specific monitors and build a tailored widget layout.
Step 2. Add New Sources
After selecting the dashboard type, the system moves to the New Sources flow.
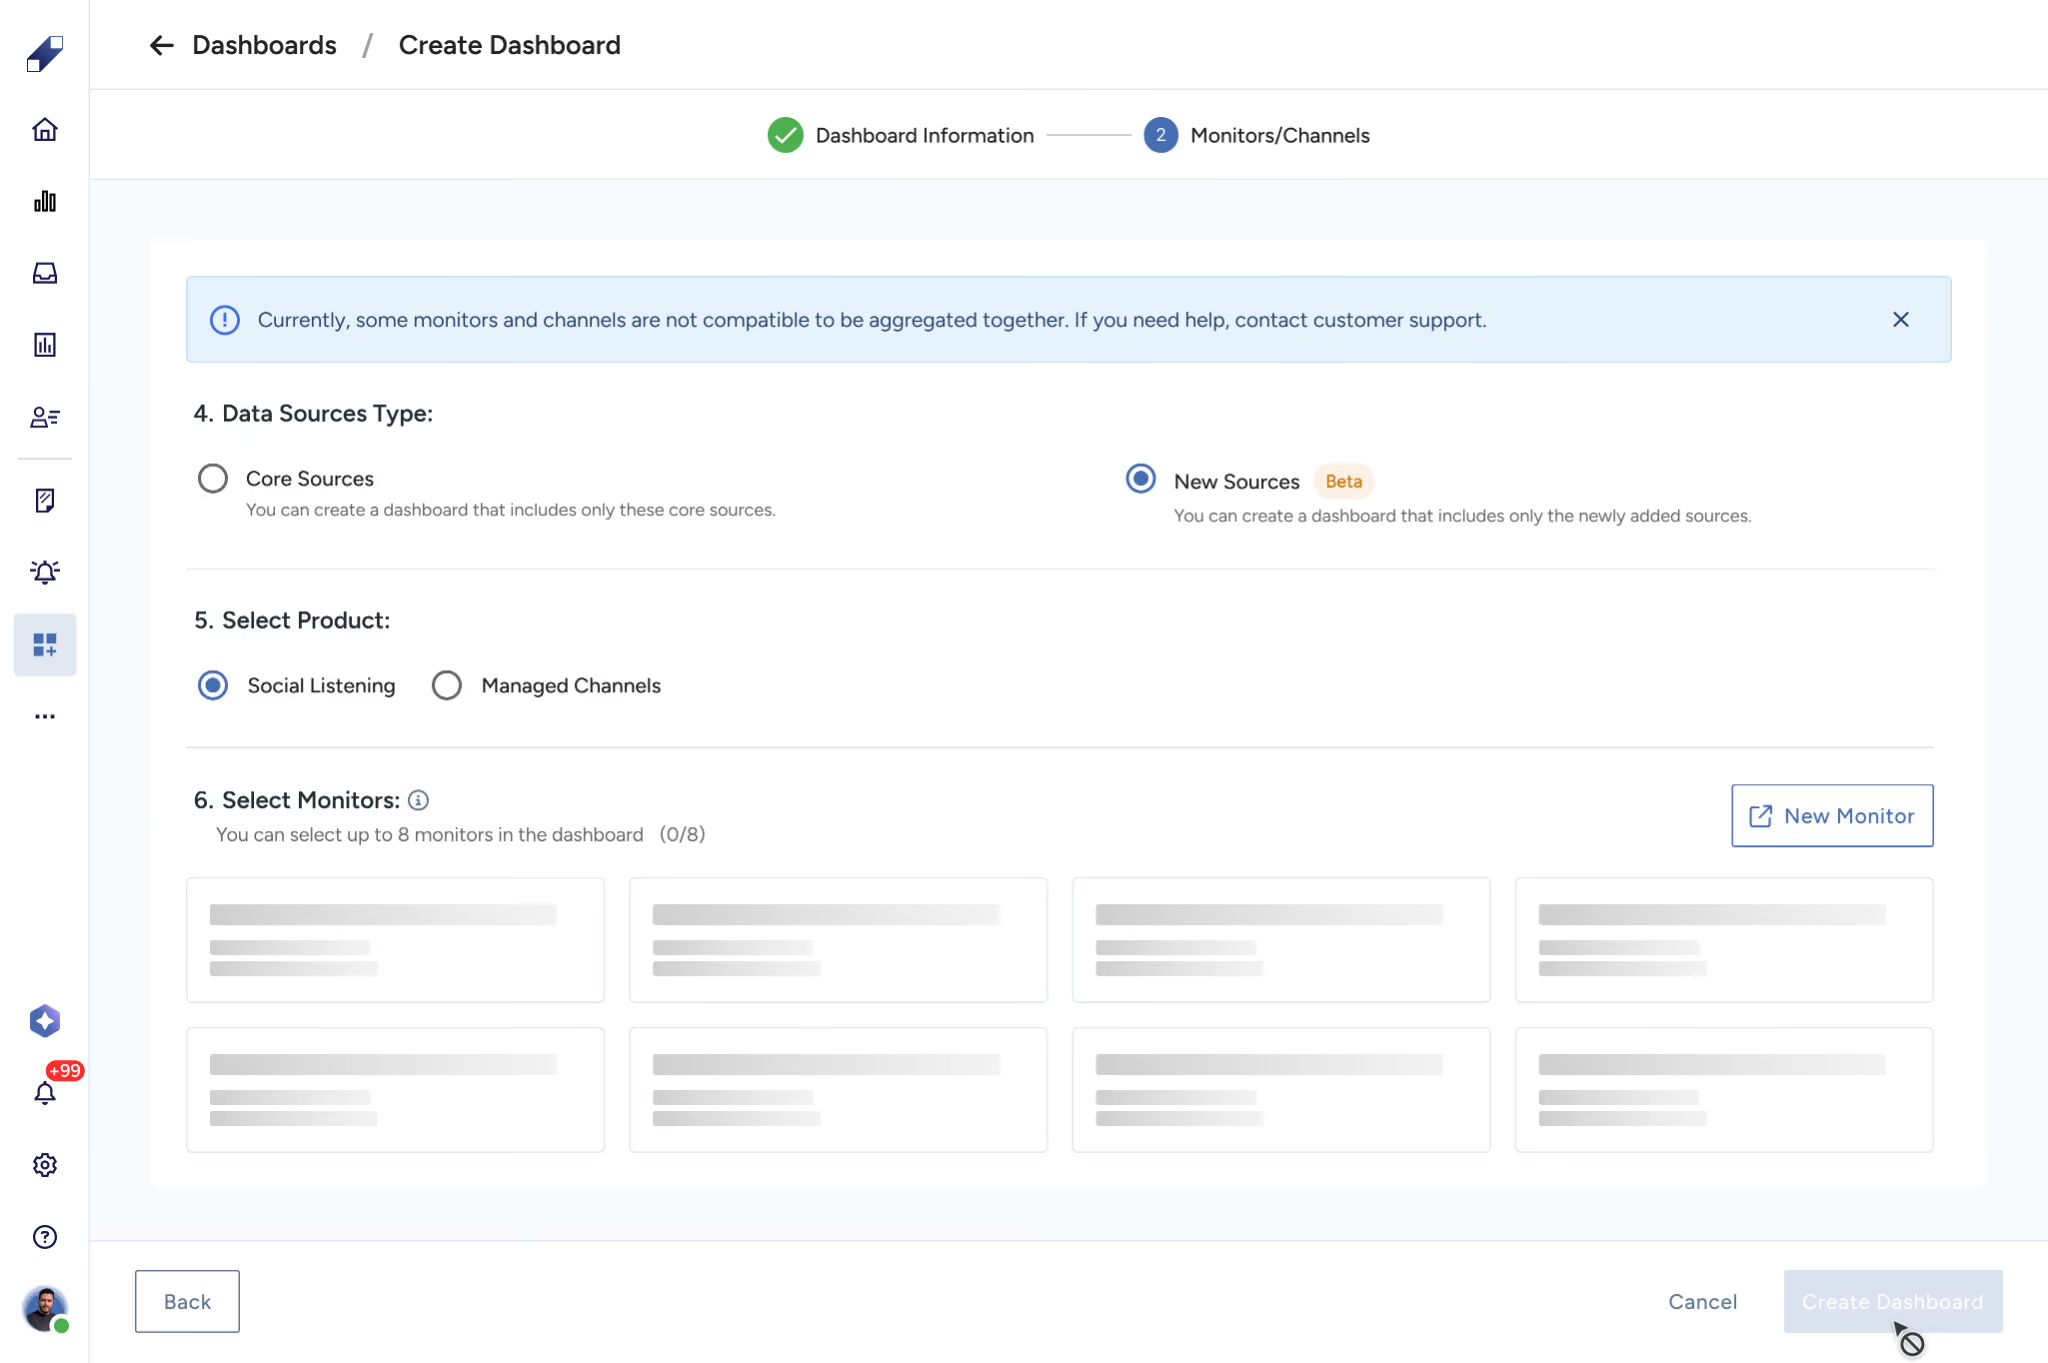
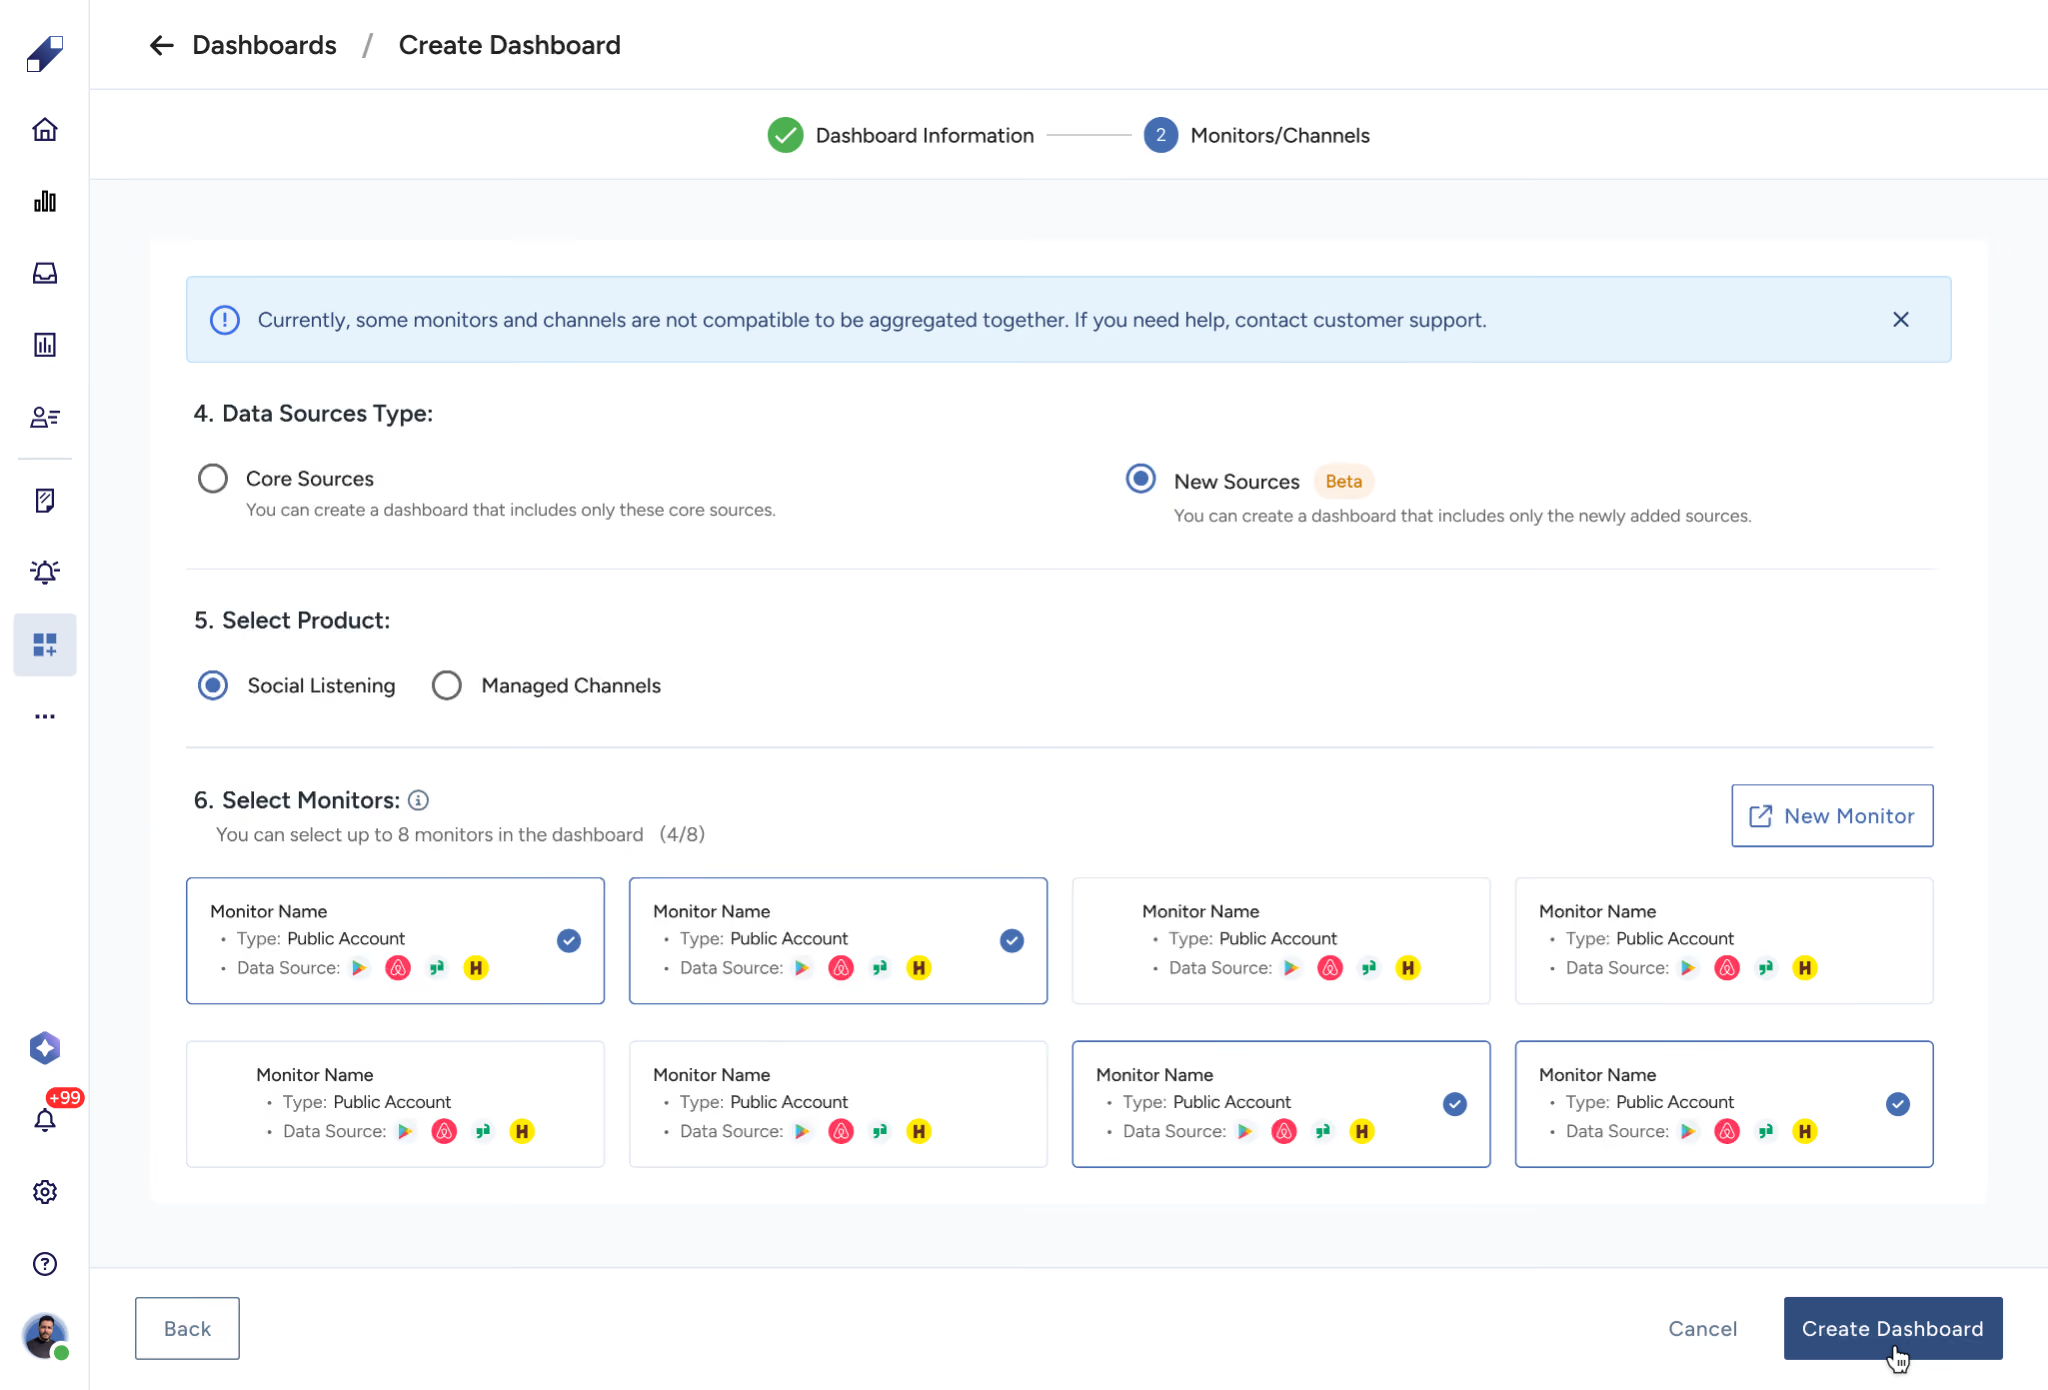
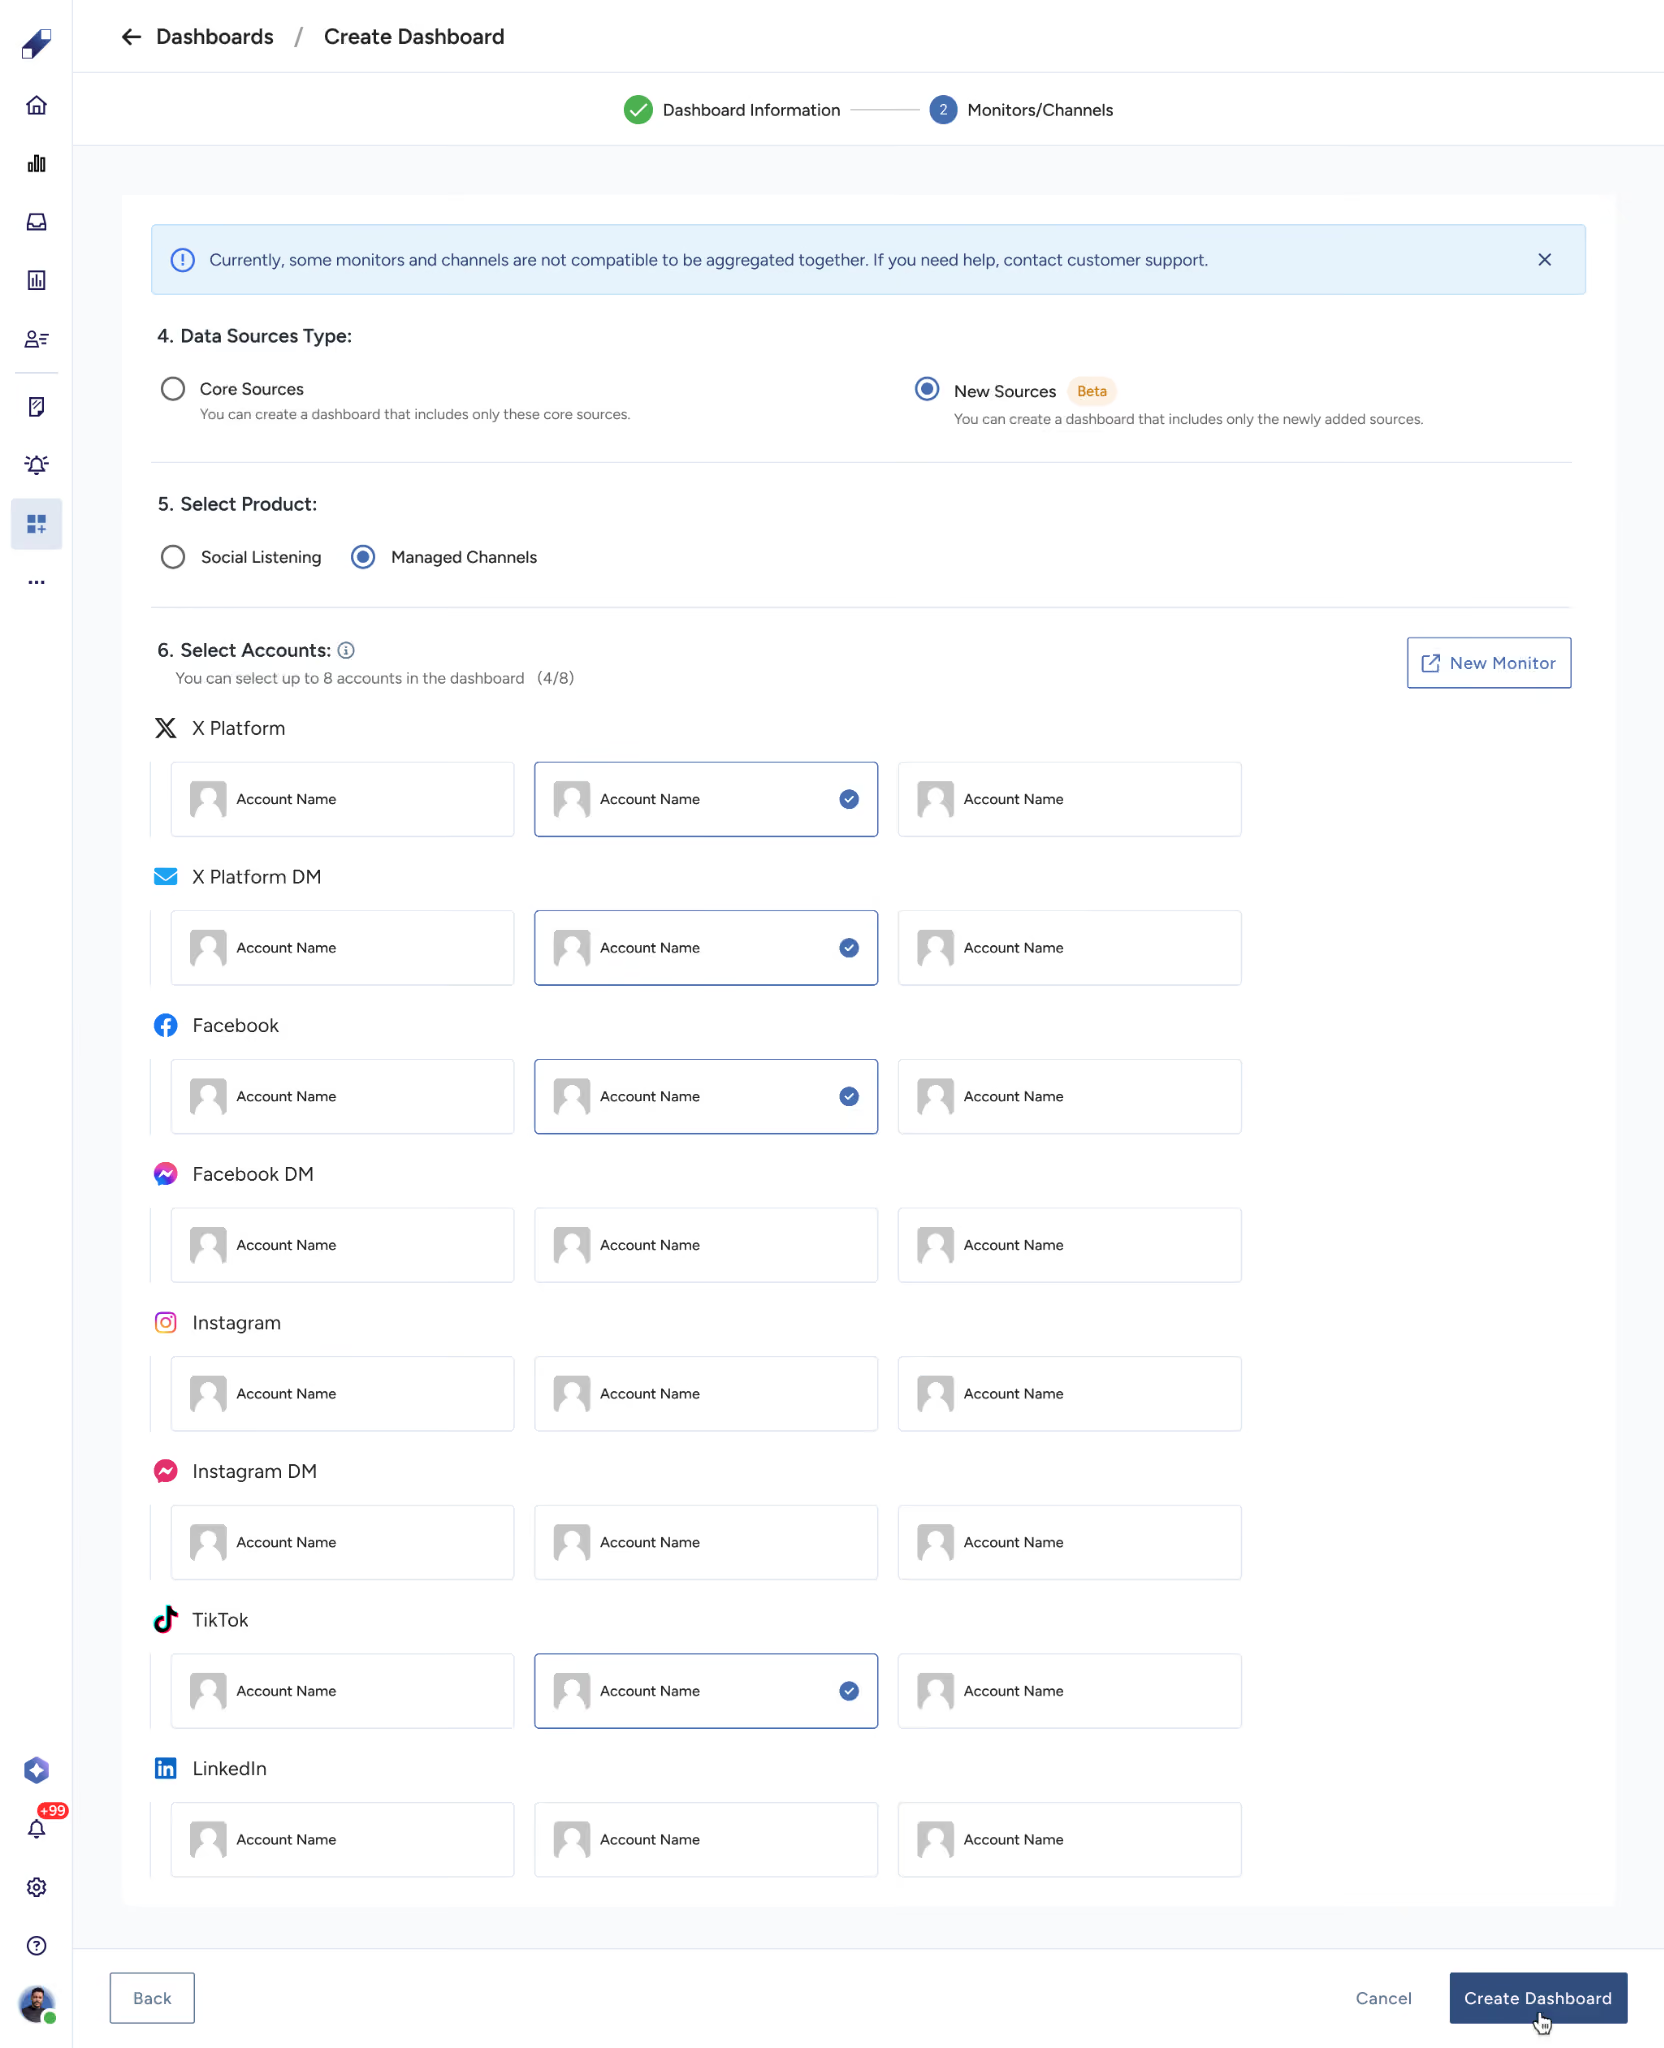
For Custom Dashboard:
- Select a Data Source Type.
- Select a Product — choose Social Listening for Public Reviews monitors, or Managed Channels for channel-based monitors.
- Select the monitors or channels you want to include.
- Widget options load based on your selections.
For Aggregate Dashboard:
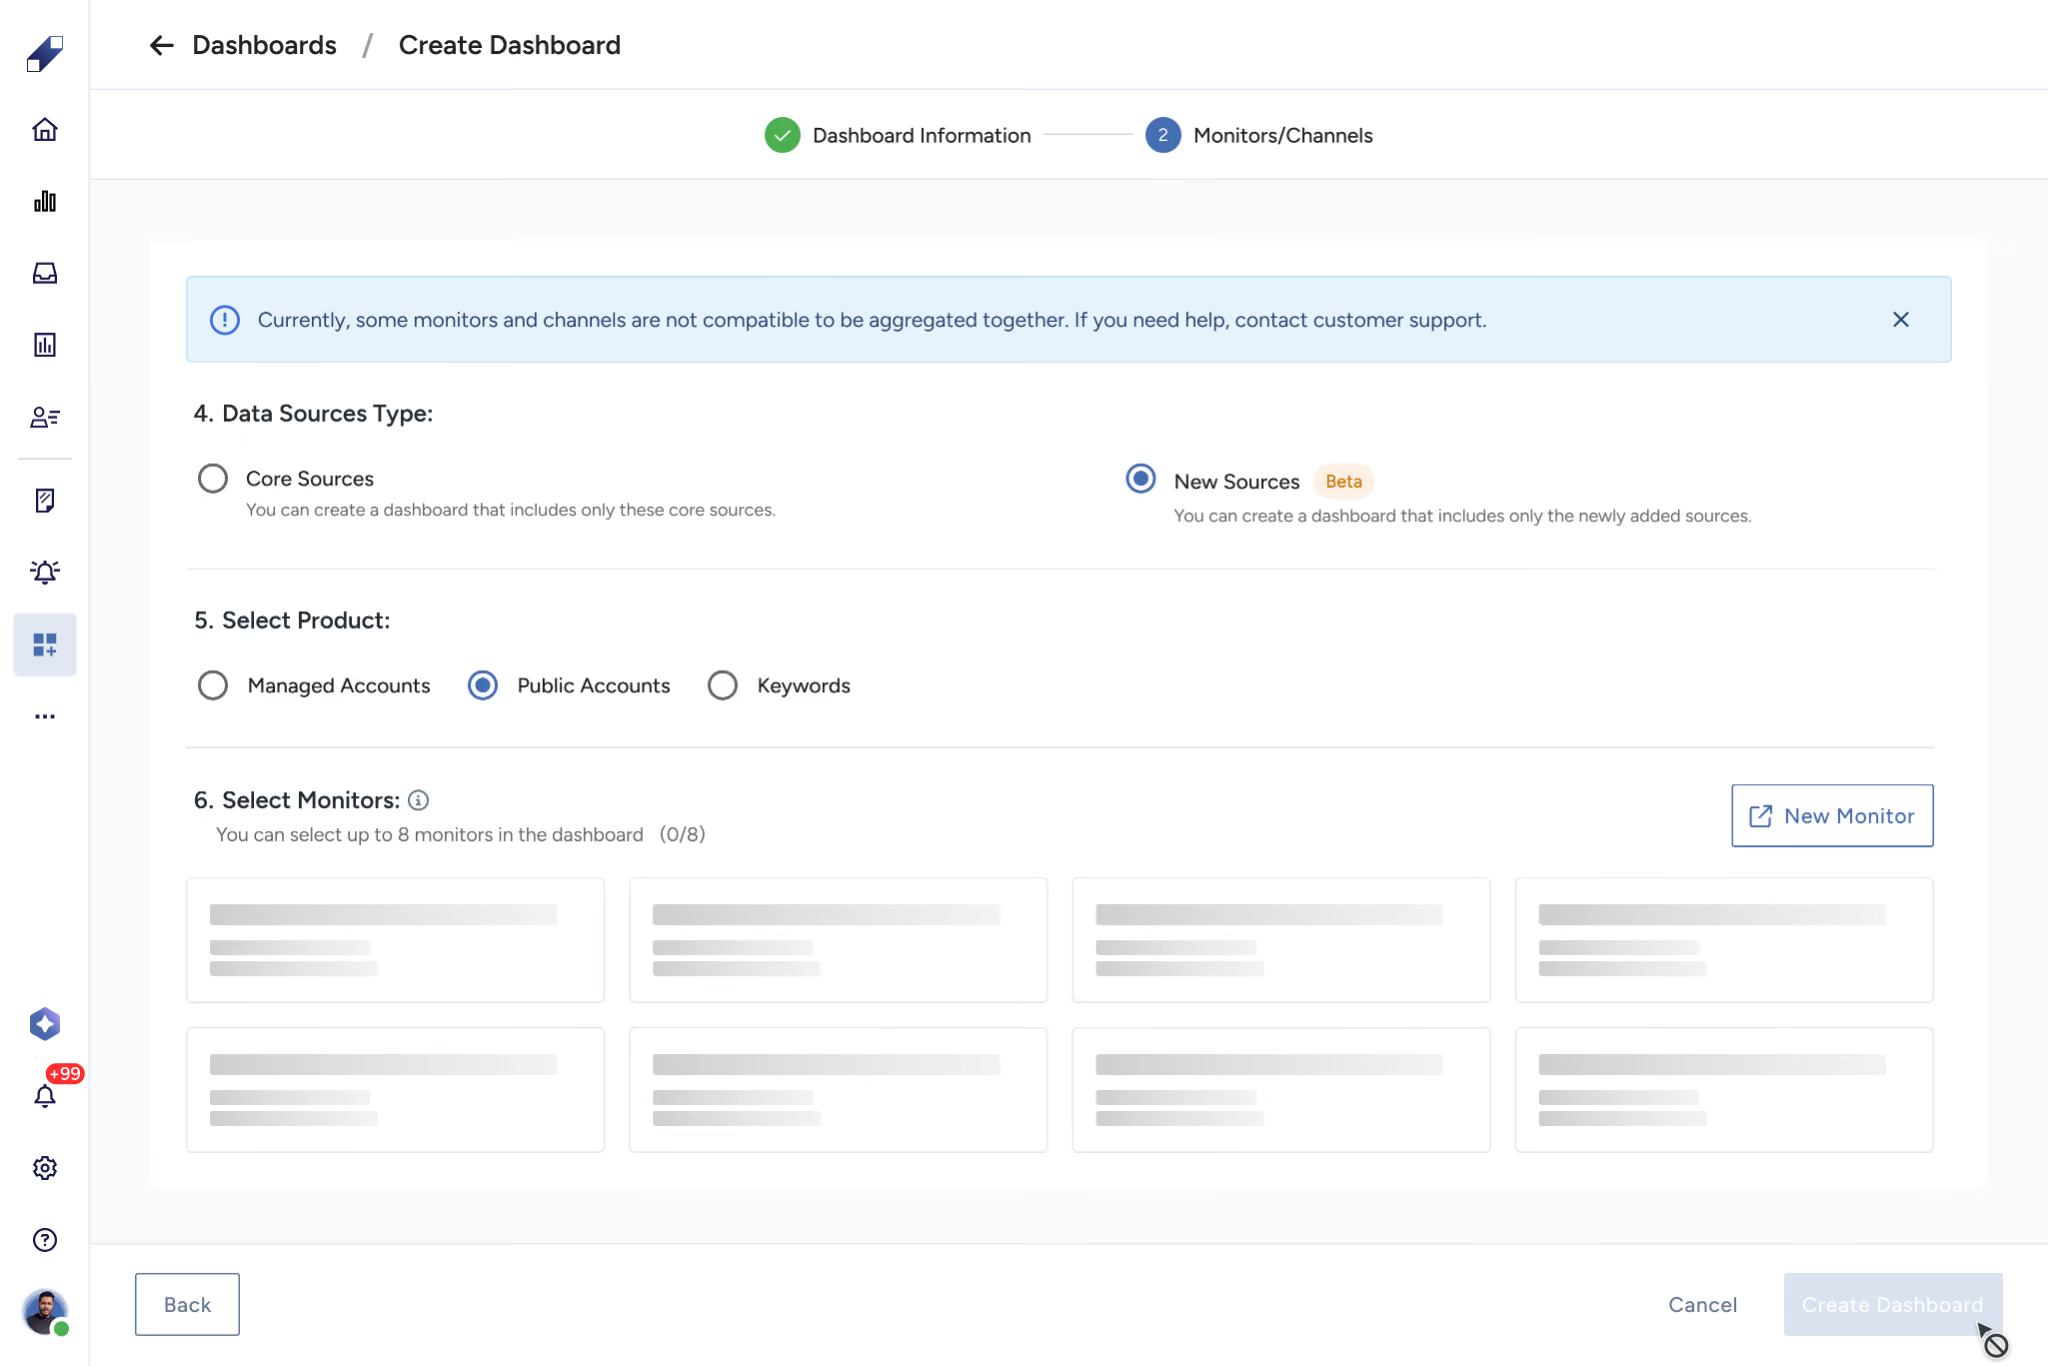
- Select a Data Source Type.
- Select a Product — choose Public Accounts to include Public Reviews monitors.
- Select the monitors to include.
- The dashboard preview loads based on your selections.
Note: The Create button remains disabled until you select at least one monitor or channel.
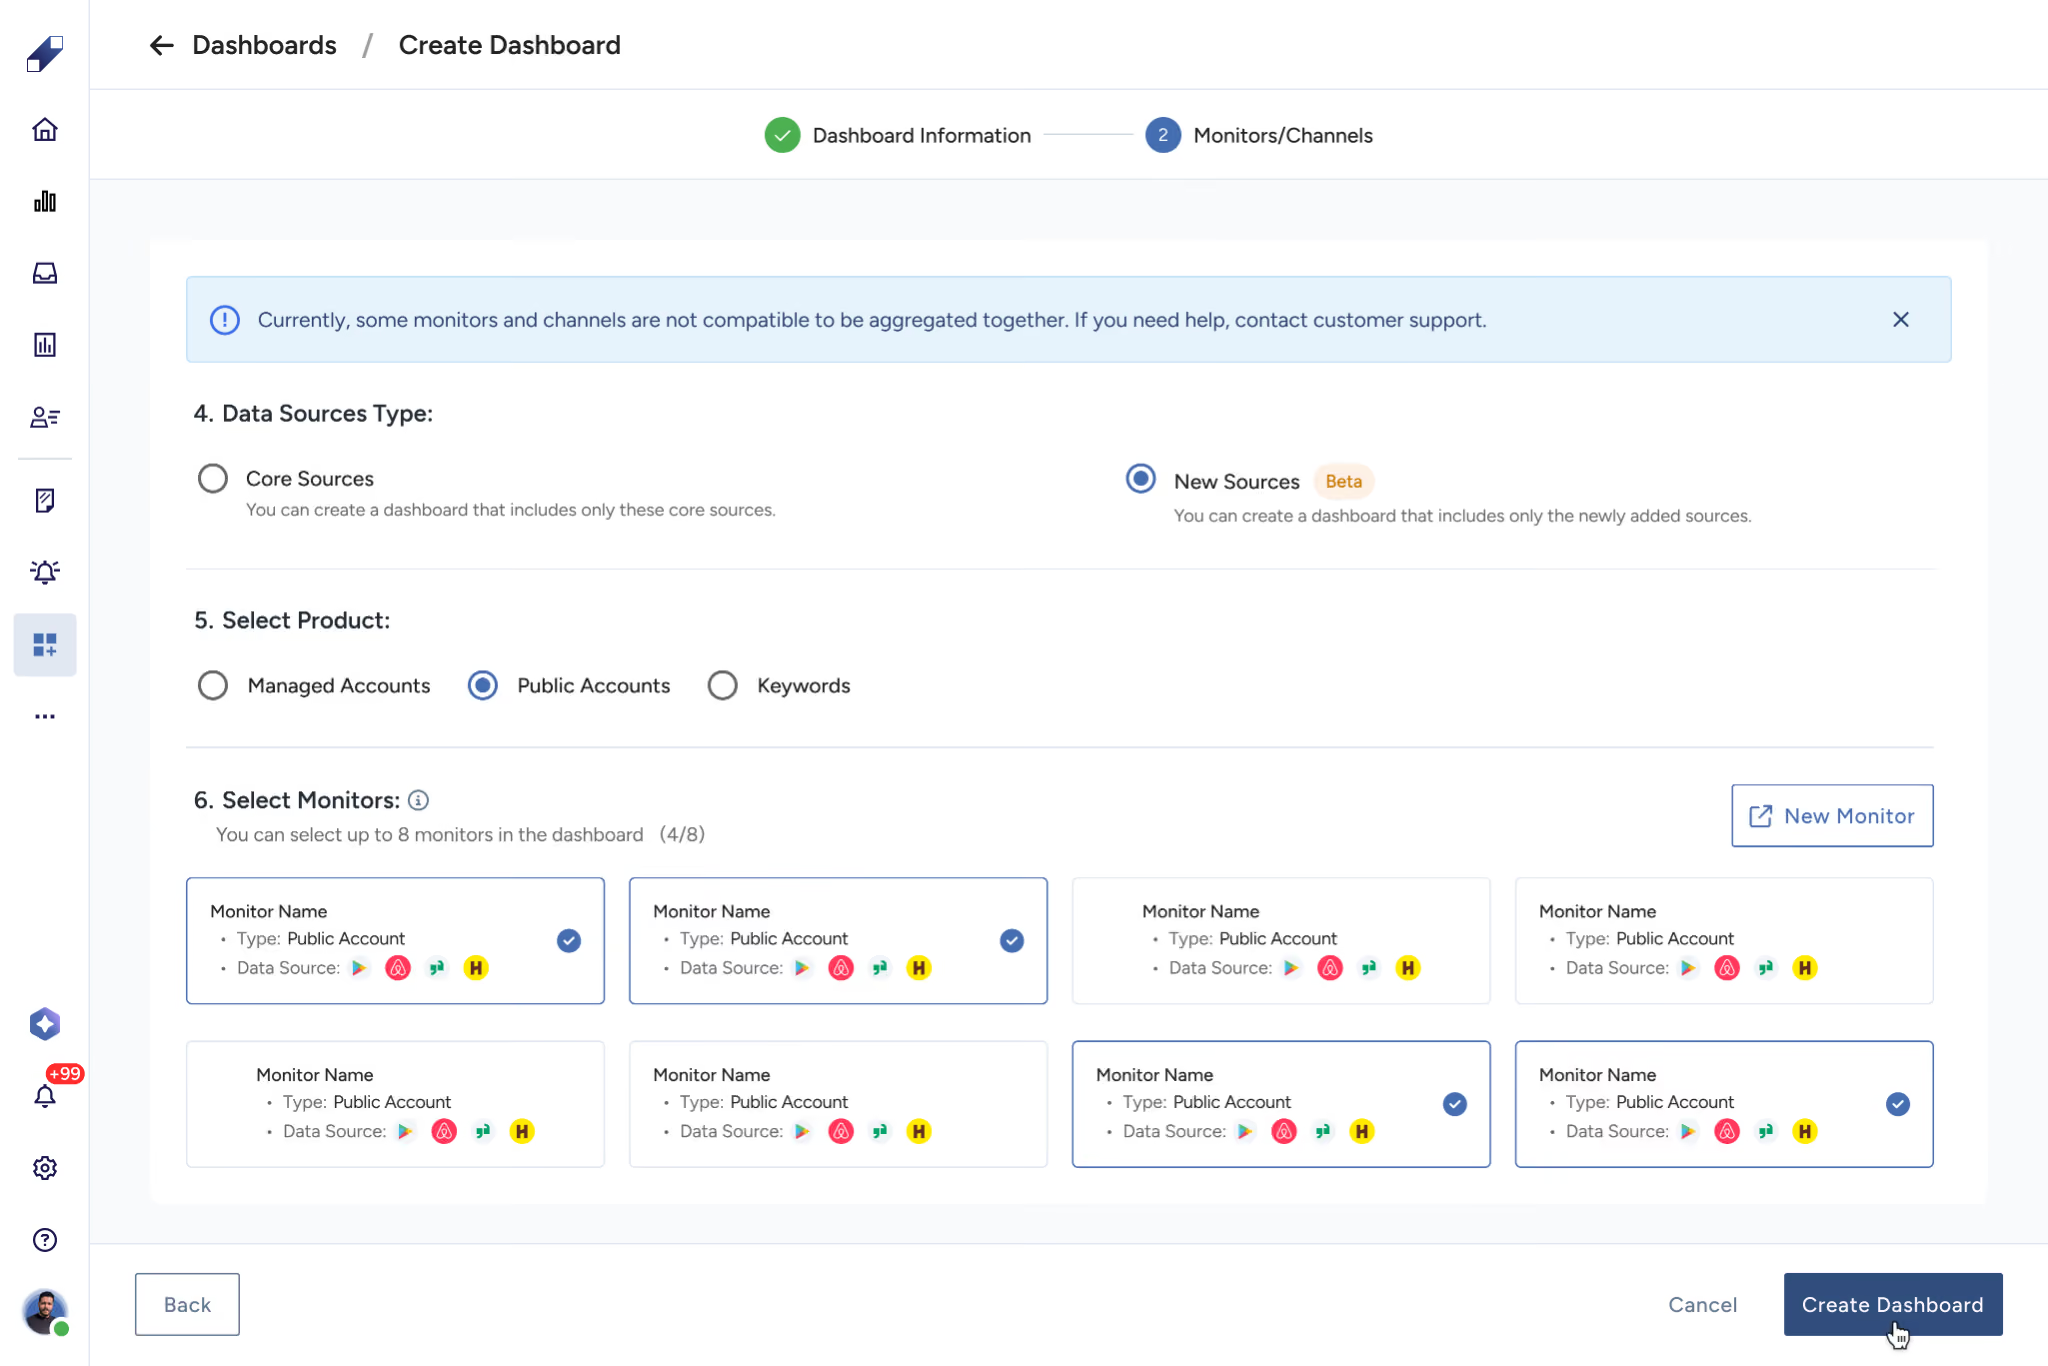
Step 3. Create the Dashboard
Click Create Dashboard. The new dashboard appears in the Dashboards list and is linked to the selected monitors.
Limits and rules:
- Up to 8 monitors can be included per dashboard.
- Mixing V1 (legacy) monitors with V2 (Unified JSON) monitors is not supported and triggers a validation error.
- Users can export dashboards as PowerPoint or Excel.
- Dashboards can be edited or deleted after creation using the dashboard management controls.
- All creation, editing, and deletion actions are logged in User Activity History and the Activity Log under Settings.
Managing Your Dashboards
Step 1. Access Dashboard Options
Find the dashboard you want to manage. Click the three-dot icon at the end of the row where the dashboard name is displayed.
Step 2. Choose an Action
From the menu that appears, you can:
- View the dashboard to analyze data.
- Edit the dashboard to make adjustments or add elements.
- Delete the dashboard if it's no longer needed.
Managing Monitors in a Dashboard
Step 1. Open Monitor Management
Inside the dashboard, click the Manage Monitors button.
[Screenshot: Manage Monitors button inside dashboard]
Step 2. Select or Deselect Monitors
A popup window will appear allowing you to select or deselect monitors. Only data source widgets related to the selected monitors will be displayed on the dashboard. Make your selections and click Save Changes.
Step 3. Apply the Changes
Click the Apply button in the upper left corner of the screen to confirm the changes.
Managing Accounts in a Dashboard
Step 1. Open Account Management
Inside the dashboard, click the Manage Accounts button.
Step 2. Select or Deselect Accounts
A popup window will appear allowing you to select or deselect accounts. Only data sources already added to the dashboard will be displayed. Make your selections and click Save Changes.
Step 3. Apply the Changes
Click the Apply button in the upper left corner of the screen to confirm the changes.
For further assistance, contact Lucidya Support.
Frequently asked questions
Managing monitors controls which monitor screens are included in the dashboard and which data source widgets are displayed. Managing accounts controls which specific accounts within those data sources are shown.
Up to 8 monitors can be included per dashboard.
No. Mixing V1 (legacy) monitors with V2 (Unified JSON) monitors is not supported and triggers a validation error.
Yes. Dashboards can be exported as PowerPoint or Excel files.
There are two common reasons. First, the monitors connected to the dashboard may be paused, or the data predates the monitor's creation date, make sure the monitors are active and check that the date range covers the period when data was collected. Second, the applied date range or filters may be excluding the relevant data, adjust the date range or change the filters to capture the data you need.