
.svg)


Understanding Ticketing Analytics in Lucidya
A reference guide to Ticketing Analytics in Lucidya, including the Overview, SLA, and Agent Performance dashboards and the metrics each one tracks.
The Ticketing Analytics section provides visibility into ticket volumes, resolution times, SLA compliance, and agent performance. Three dashboards are available: Overview, SLA, and Agent Performance.
All analytics views support filtering by assigned agents, assigned teams, ticket status, ticket type, ticket priority, data source, and time range. Charts and widgets update based on the selected filters. Individual charts can be downloaded as PNG or PDF, and the full dashboard can be exported as Excel.
Overview Dashboard
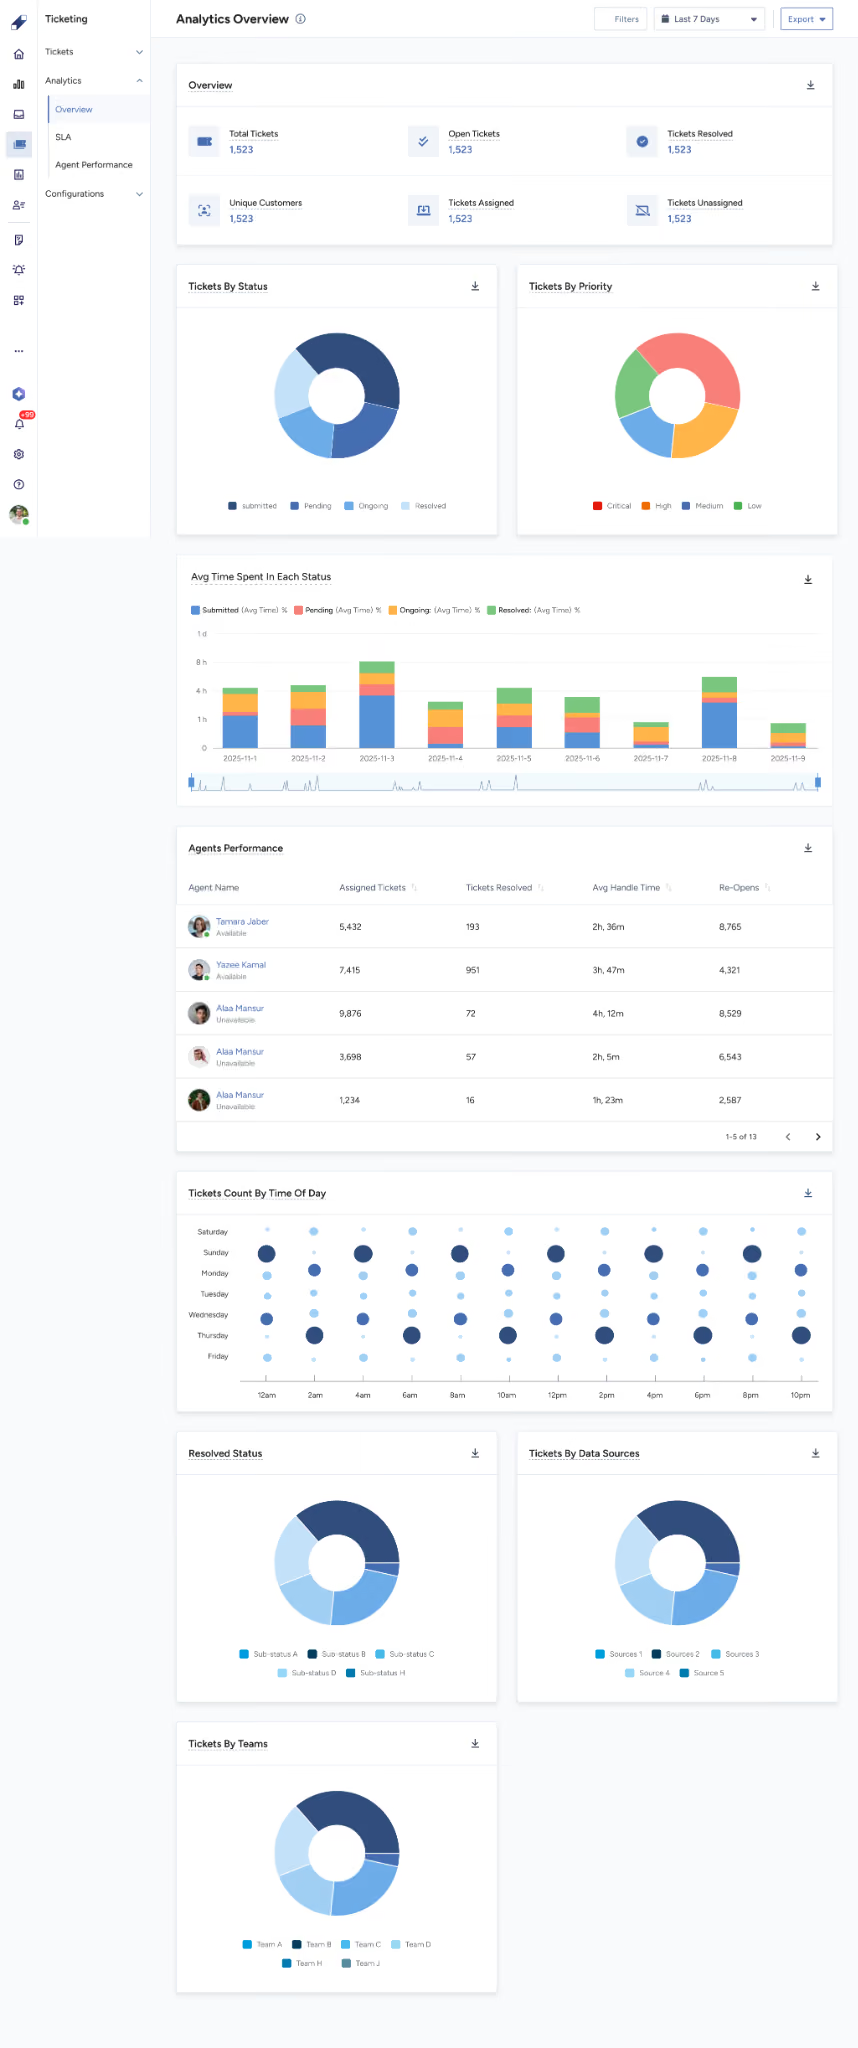
The Overview dashboard provides a high-level snapshot of your ticketing operation.
Headline metrics: Total Tickets, Open Tickets, Tickets Resolved, Unique Customers, and Tickets Assigned vs Unassigned.
Distribution charts: Tickets by Status (pie chart across Submitted, Pending, Ongoing, and Resolved), Tickets by Priority (pie chart across Critical, High, Medium, and Low).
Timing analysis: Average Time Spent in Each Status (bar chart showing how long tickets typically sit in each status, useful for identifying where cases slow down).
Agent performance table: A sortable breakdown of each agent's assigned tickets, resolved tickets, average handle time, and re-opens.
Volume patterns: Tickets Count vs Time of Day (bubble chart mapping ticket volume by day of the week and hour of the day for spotting peak periods and staffing gaps).
Additional breakdowns: Resolved Status, Tickets by Account, and Tickets by Teams (pie charts for deeper segmentation).
SLA Dashboard
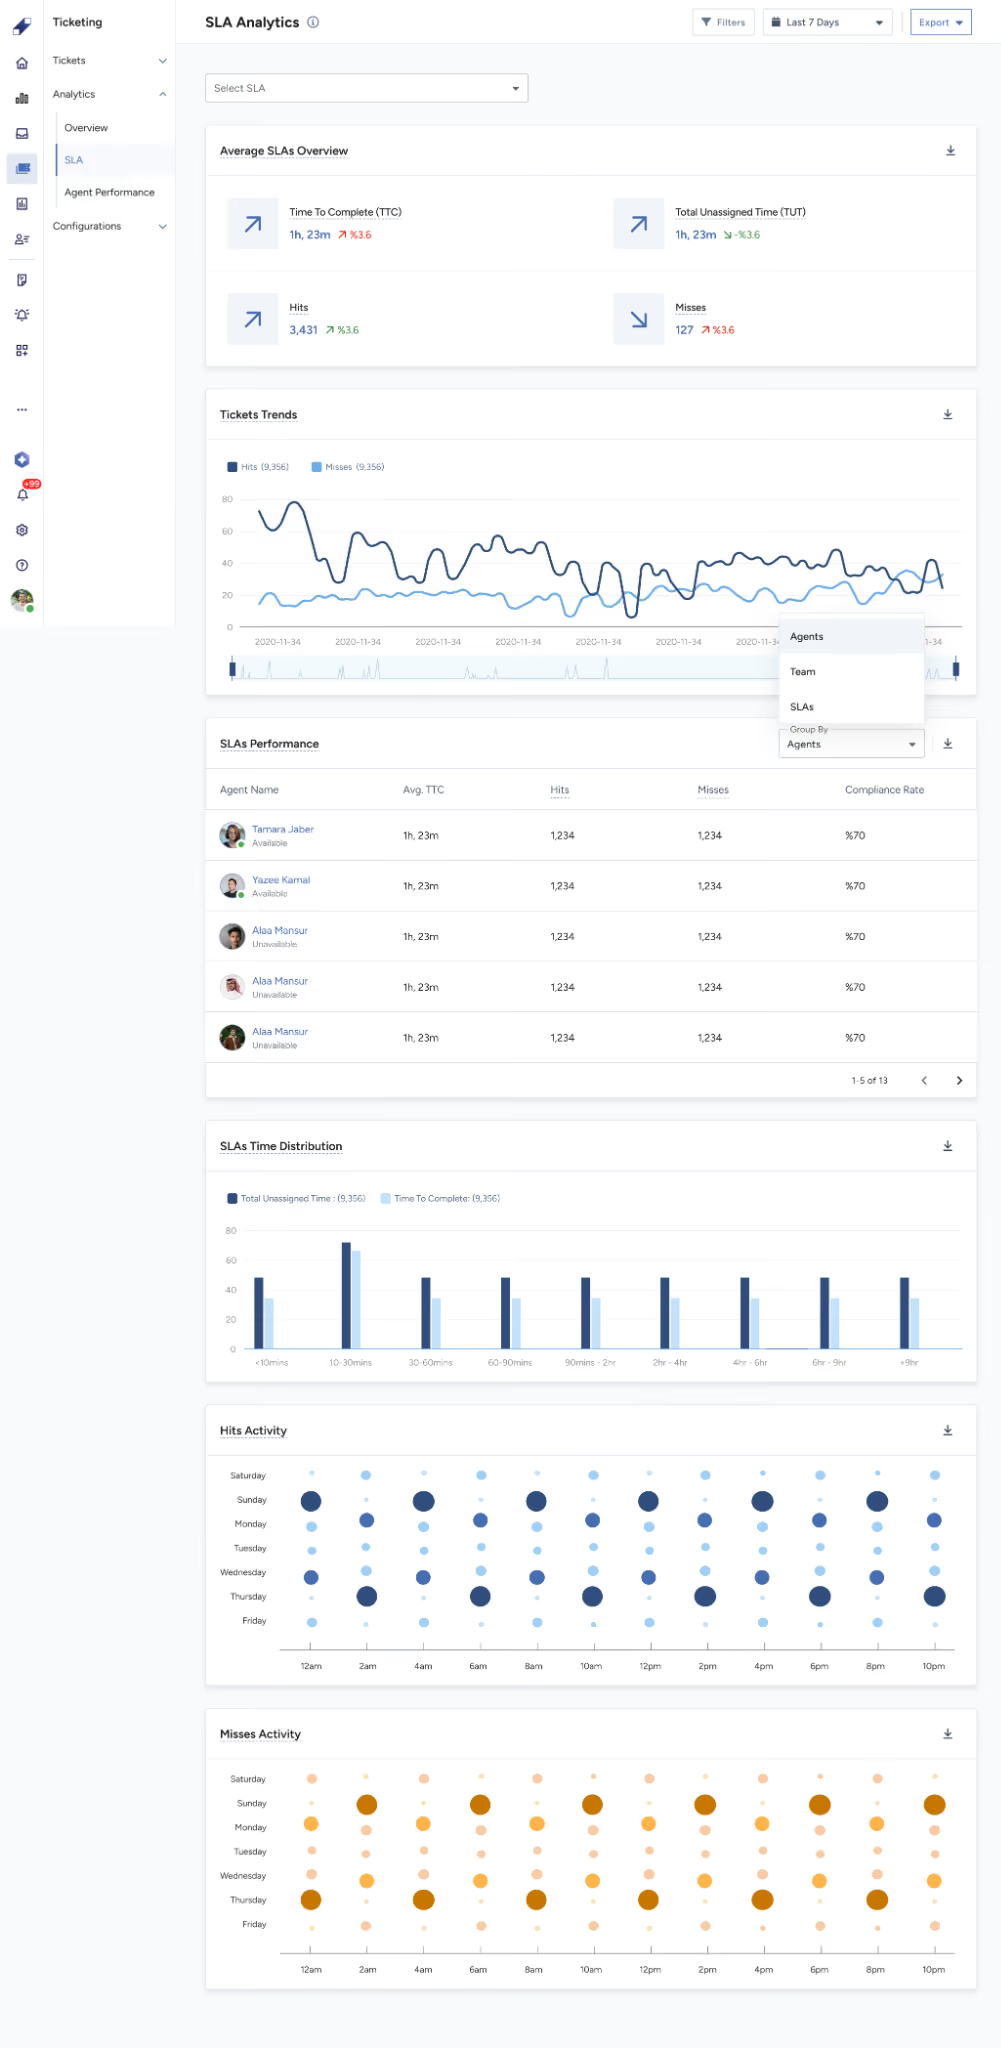
The SLA dashboard tracks how well your team is meeting service level agreements configured in ticket templates.
Average SLAs Overview: summarizes time to complete (TTC) and total unassigned time (TUT), along with overall SLA hits and misses.
Tickets Over Time: a line chart tracking SLA hits and misses over the selected period.
SLAs Performance: breakdowns by agents, teams, or individual SLAs to identify where commitments are being met and where they are falling short.
SLAs Time Distribution: a bar chart showing time spent across total unassigned time, first response time, next response time, and time to complete.
Hits Activity and Misses Activity: two bubble charts mapping when SLA hits and misses occur by day and hour.
Use the Select SLA dropdown at the top of the tab to focus on a specific SLA configuration.
Agent Performance Dashboard
The Agent Performance dashboard provides a focused view on individual agents.
Overview panel: shows manual vs auto assignments, total resolved tickets, average handle time, and re-opened tickets for the selected agent.
Agent Status Overview: tracks how agents spend their time across available, busy, in a meeting, on break, and unavailable statuses. Toggle between average time and total time.
Agent Inbox Performance: a line chart showing assigned vs completed tickets over time.
Agents Performance table: covers average TTC, SLA misses and hits, compliance rate, and average handling time per agent.
Agent Status Summary table: a detailed time breakdown per agent across all status types.
Agents Distribution: a pie chart showing how ticket volume is distributed across the team.
For further assistance contact Lucidya Support.
Frequently asked questions
The Overview dashboard shows overall ticket volumes, distribution, timing, and agent workload. The SLA dashboard specifically tracks whether your team is meeting defined service level targets, with hit and miss tracking and trend analysis.
Hits are tickets where all applicable SLA targets were met within the defined timeframes. Misses are tickets where at least one SLA target was exceeded.
Yes. Individual charts can be downloaded as PNG or PDF. The full dashboard can be exported as an Excel file.
It maps ticket volume by day of the week and hour of the day, revealing when your team is busiest. This helps with staffing decisions and identifying peak periods that may need additional coverage.
Yes. All analytics views support filtering by assigned agents, assigned teams, ticket status, priority, type, data source, and time range.