
.svg)


Dashboard Types in Social Listening
A reference guide to the two dashboard types in Social Listening, Aggregate Dashboards for cross-monitor analysis and Custom Dashboards for focused, tailored views.
Dashboards visualize conversation data collected through Social Listening monitors. They present insights such as conversation volume, sentiment distribution, and engagement trends through charts and visual widgets, helping teams track changes and evaluate performance over time.
Two dashboard types are available in Social Listening: Aggregate Dashboards and Custom Dashboards.
Aggregate Dashboards
Aggregate Dashboards combine insights from multiple monitors into a single view. They provide a broader perspective by consolidating data across different monitors and sources.
Use Aggregate Dashboards when you need to analyze overall brand activity across several monitors, compare conversations across campaigns or competitors, or monitor industry-wide trends from multiple data sources.
Custom Dashboards
Custom Dashboards let you create tailored views based on specific analytical needs. You select the monitors, topics, or campaigns you want to focus on and configure the dashboard layout with the widgets most relevant to your analysis.
Use Custom Dashboards when you need to track the performance of a specific campaign, monitor conversations around a particular topic or product, or build views customized for specific team workflows or reporting requirements.
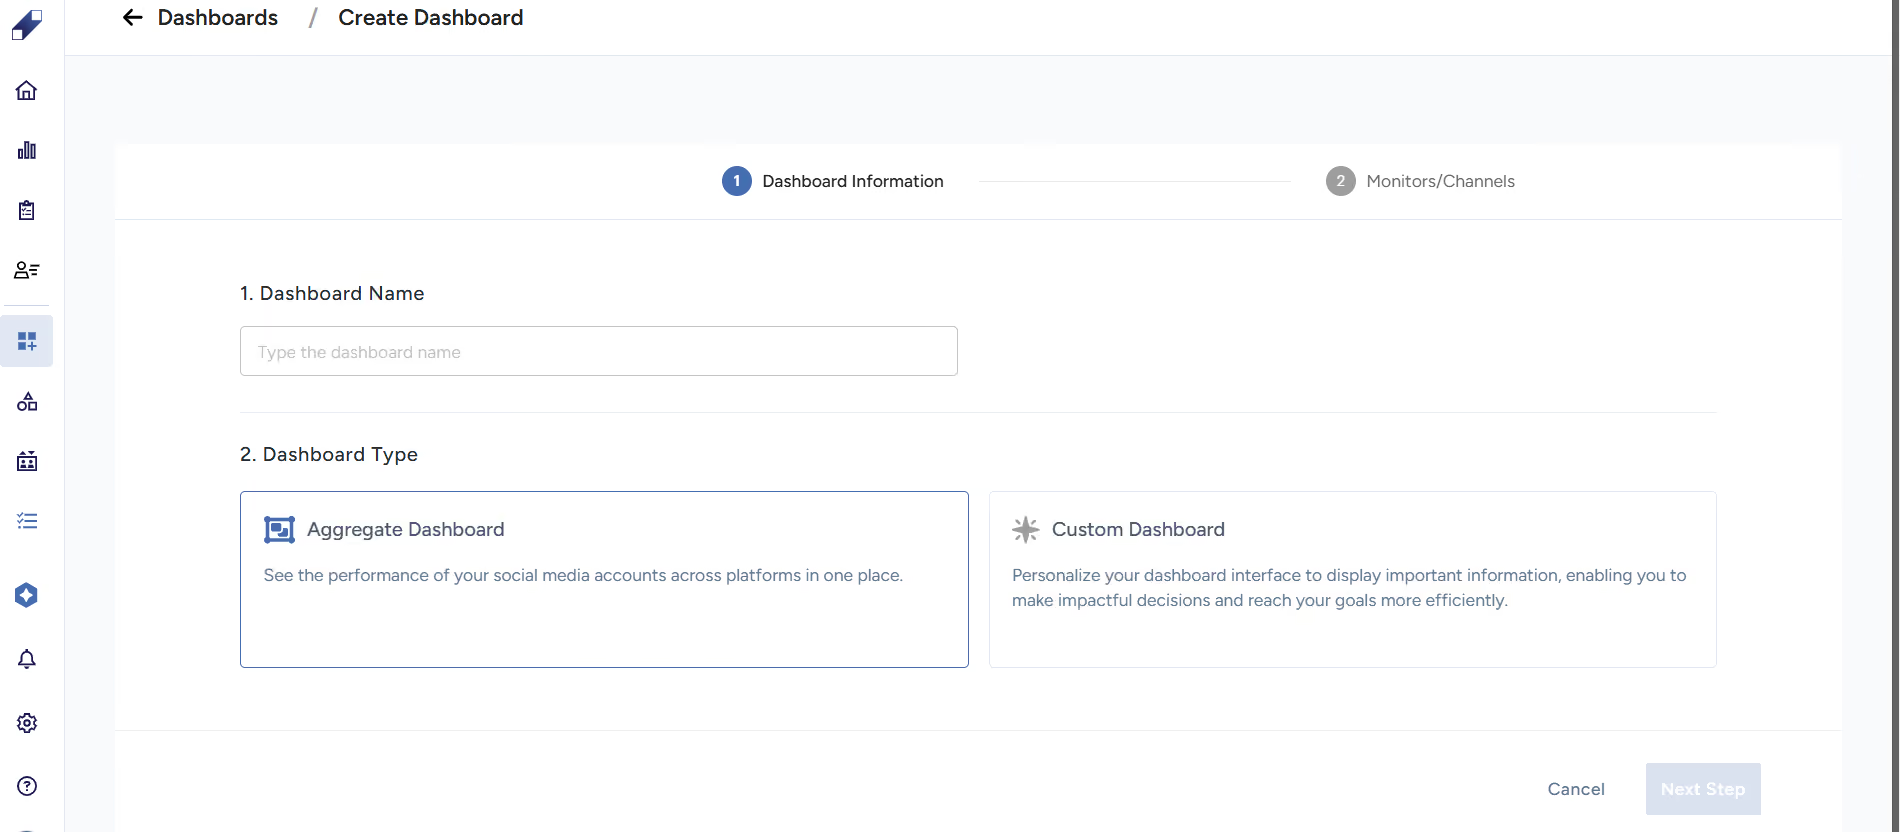
How to Create a Dashboard
Both dashboard types are created from the same starting point. Go to Dashboards from the left sidebar. Click New Dashboard. Enter a dashboard name and select the dashboard type.
For Aggregate Dashboards, select a data source type and product, then choose the monitors to include. The dashboard preview loads automatically.
For Custom Dashboards, select a data source type and product (Social Listening for Public Reviews monitors, or Managed Channels for channel-based monitors), then select the monitors or channels to include. Widget options load based on your selections.
Up to 8 monitors can be included per dashboard. Mixing legacy (V1) monitors with Unified JSON (V2) monitors is not supported. Dashboards can be exported as PowerPoint or Excel. All creation, editing, and deletion actions are logged in User Activity History.
For live real-time dashboards, see Understanding the Live Dashboard in Social Listening.
For further assistance contact Lucidya Support.
Frequently asked questions
Aggregate Dashboards combine data from multiple monitors into one unified view for broader analysis. Custom Dashboards let you build focused views around specific monitors, topics, or campaigns with a tailored widget layout.
Up to 8 monitors per dashboard.
Yes. Custom Dashboards support data from both Social Listening monitors and Managed Channels.
Yes. Dashboards can be exported in PowerPoint or Excel format. See How to Export Instant Reports in Social Listening for details.