
.svg)


How to Create a Custom Dashboard in OmniServe
Learn how to create, share, and manage custom dashboards in OmniServe using widgets from Inbox, SLAs, and Agents.
You can create custom dashboards in OmniServe to bring together widgets from the Inbox, SLAs, and Agents modules in one configurable view. Team members and managers who monitor daily operations use custom dashboards to track performance without switching between modules. This centralizes your operational visibility and reduces the time spent navigating across the platform.
What You Can Do
- Create, edit, and delete custom dashboards
- Add widgets from the Inbox, SLAs, and Agents modules
- Filter dashboard data by selected monitors and channels
- Share dashboards with specific teams or users
- Export dashboard data to Excel
Before You Start
- Access to the OmniServe product
- A user role that allows dashboard creation (agents can view dashboards shared with them but cannot create dashboards)
- At least one monitor or channel connected to OmniServe if you want to filter data
Step by Step
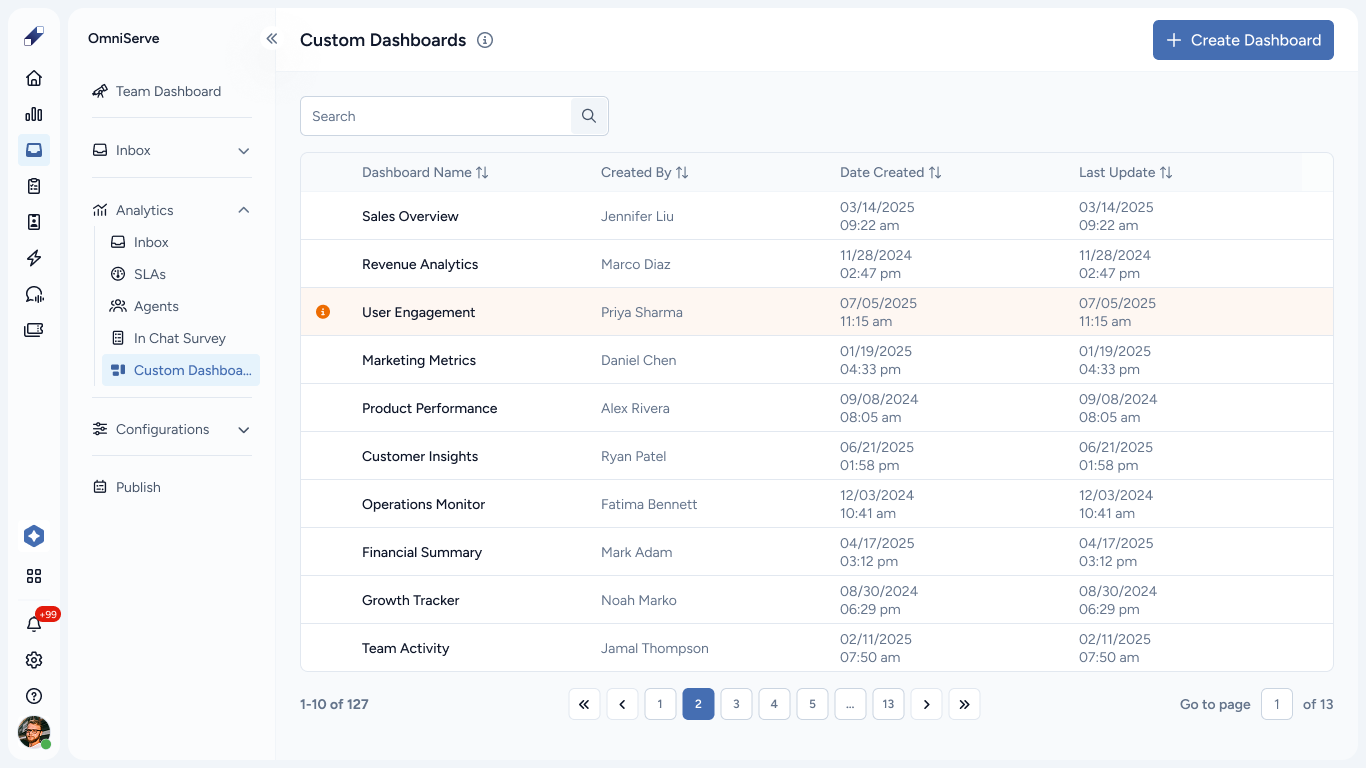
Step 1 – Navigate to Custom Dashboards Go to OmniServe → Analytics → Custom Dashboards, then click Create Dashboard.
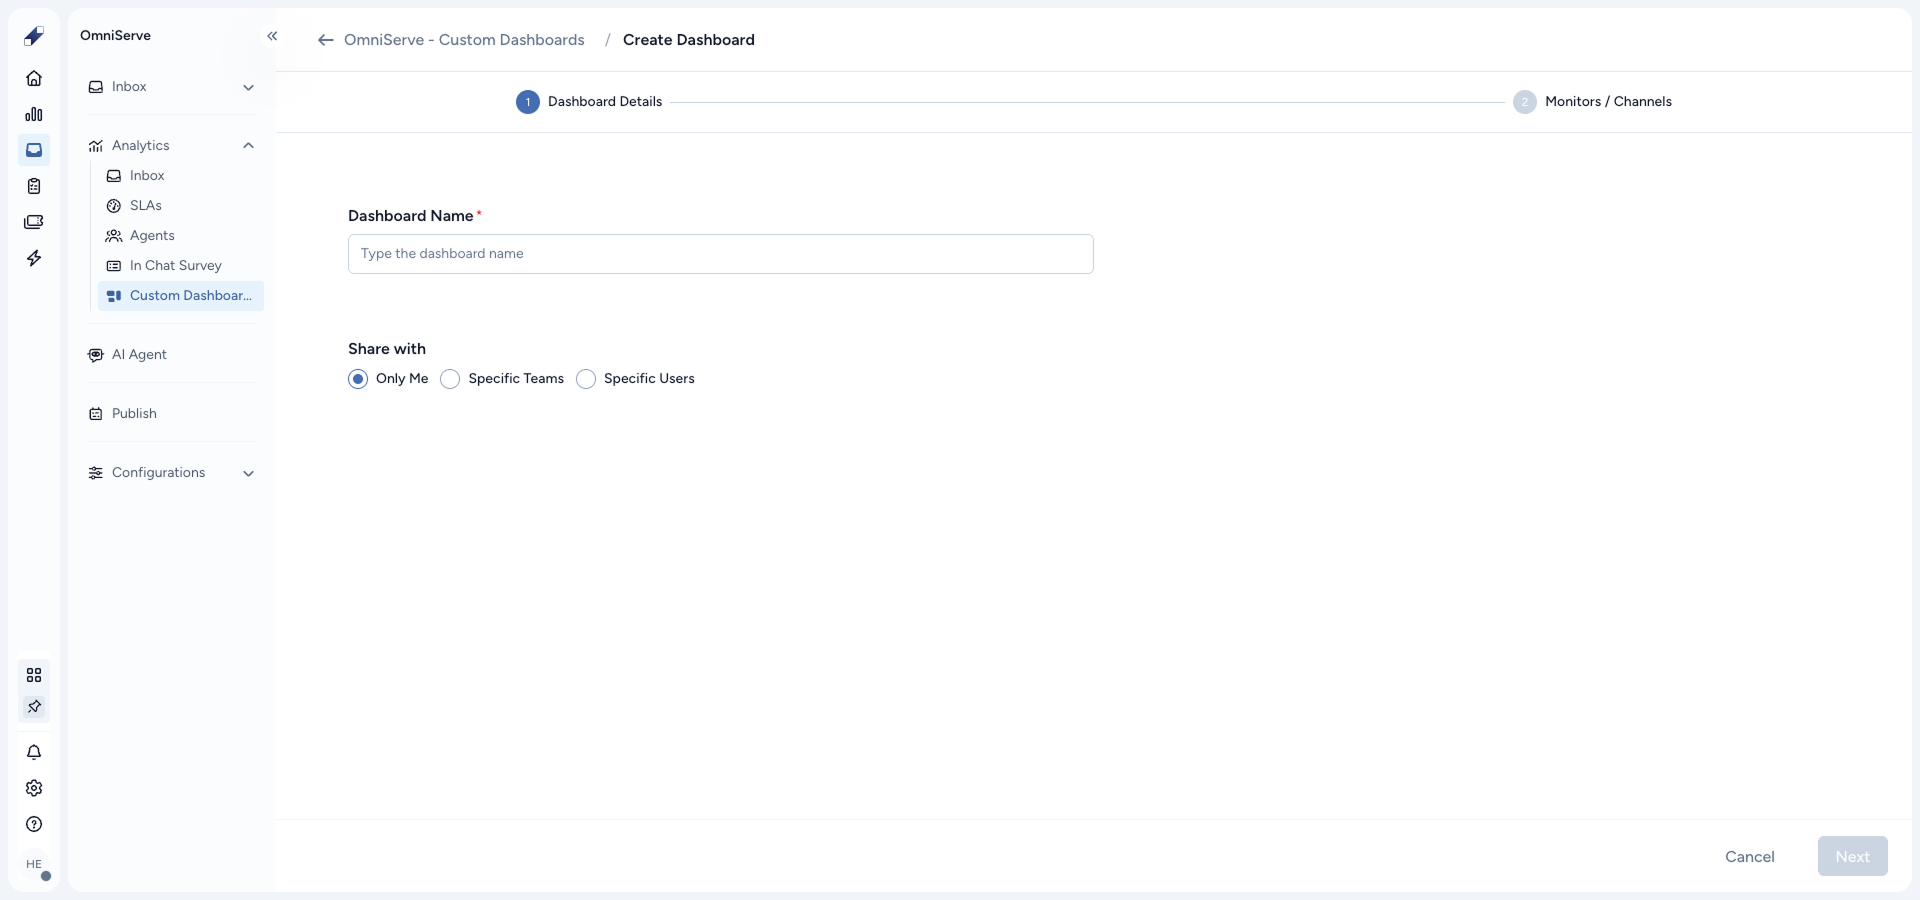
Step 2 – Enter the Dashboard Details In the Dashboard Details step, type a name for your dashboard. The name must be:
- Between 3 and 100 characters
- Unique within your accessible scope
Then select who can access the dashboard under Share with:
- Only Me
- Specific Teams
- Specific Users
Only teams with access to OmniServe appear in the list. Only active users can be selected; inactive users appear dimmed and cannot be added.
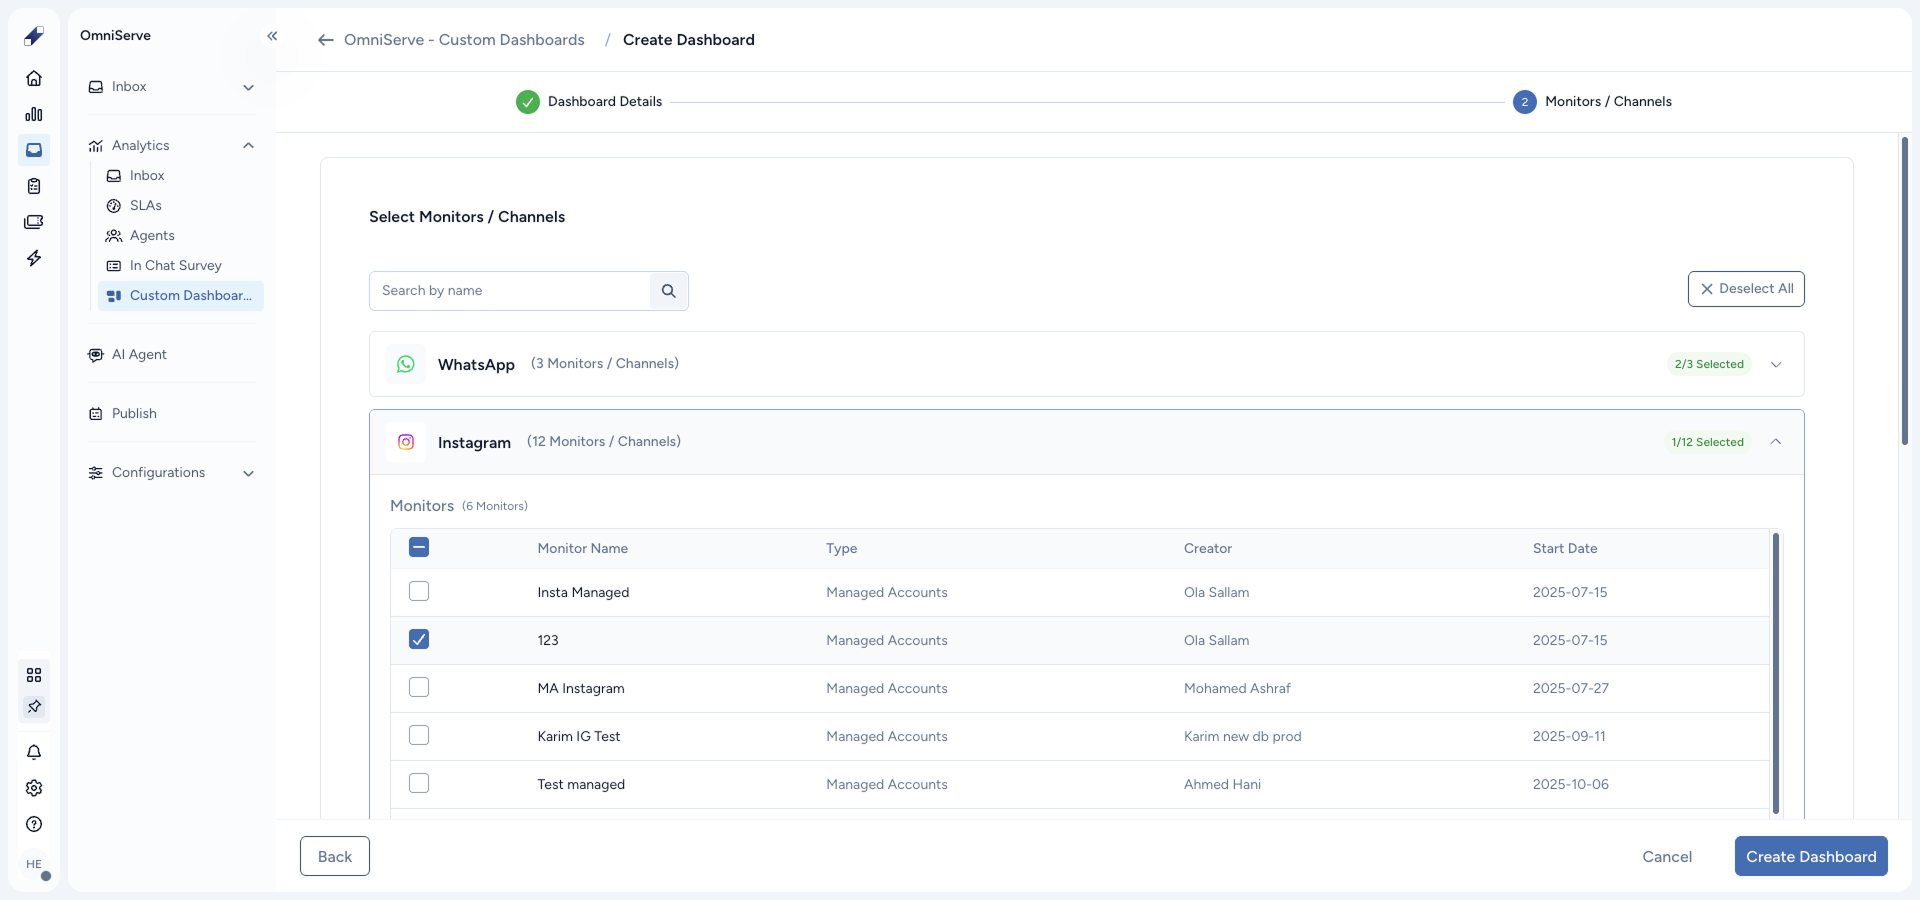
Step 3 – Select Monitors and Channels In the Monitors/Channels step, choose the monitors and channels that will act as data filters for the dashboard. You can search by name or expand each platform to select individual monitors and channels.
- You can select up to 150 monitors and channels combined
- Only monitors and channels connected to OmniServe are displayed
- If you make no selection, the dashboard shows all data within your permission scope
The monitors and channels you select here are the only ones available in the dashboard filters later. Click Create Dashboard to save.
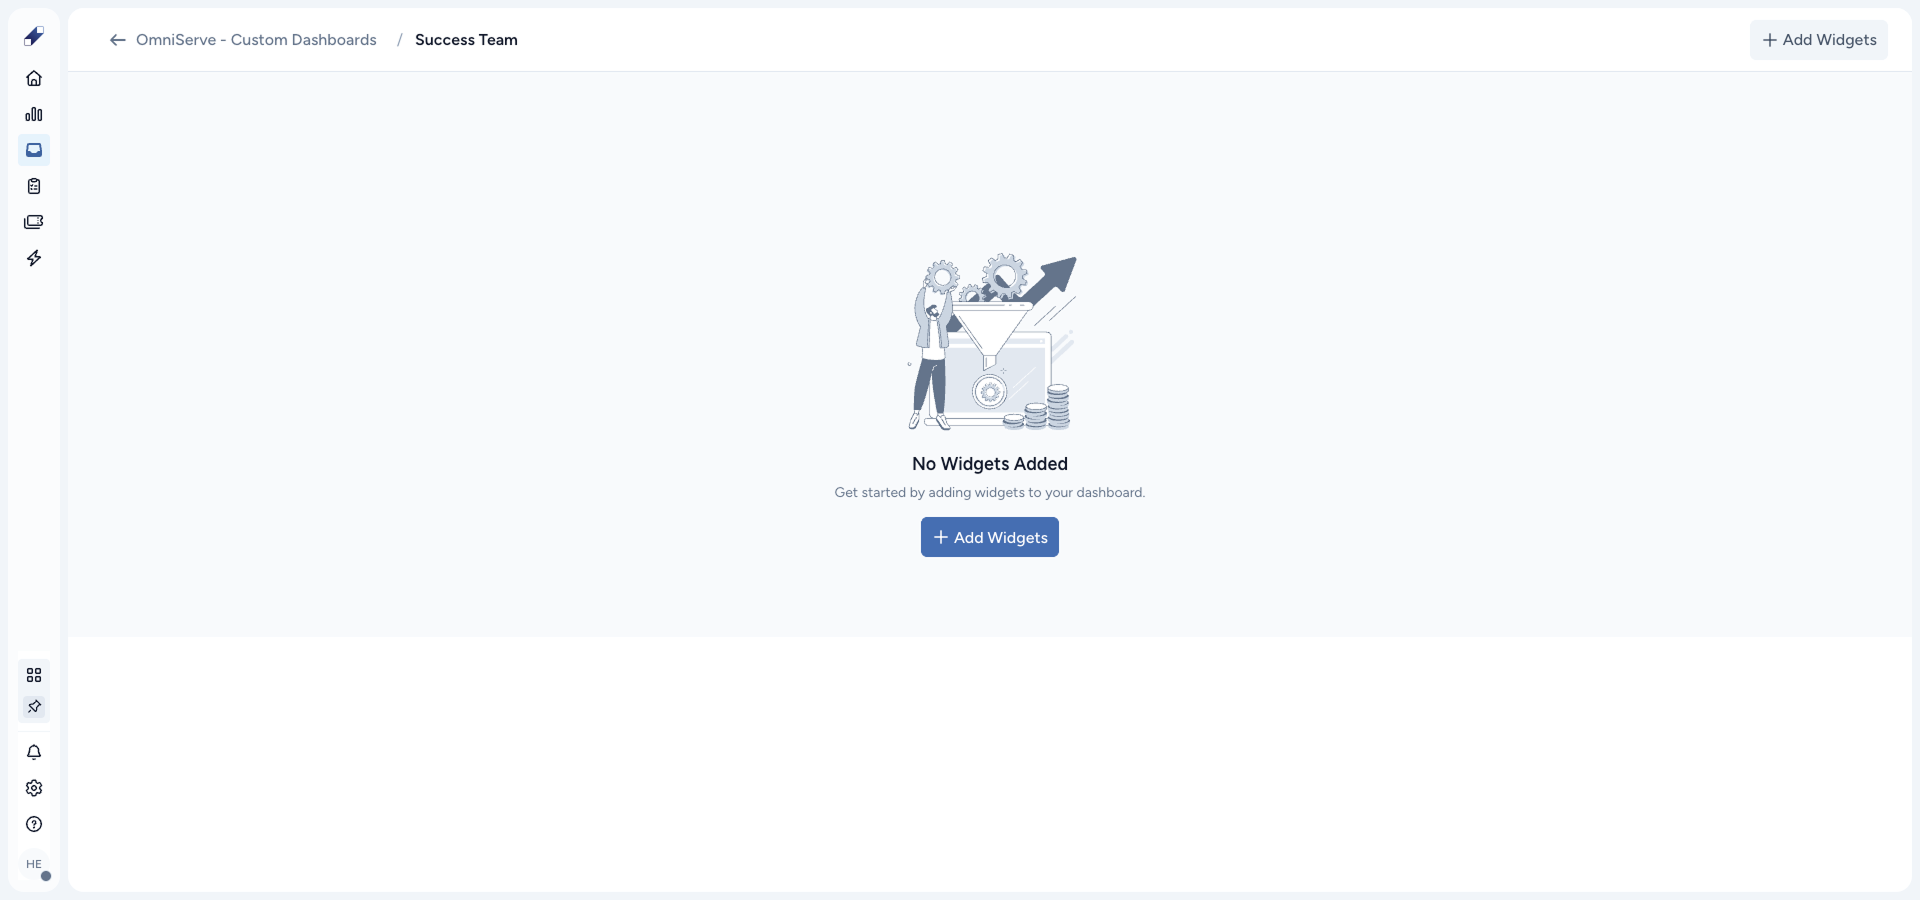
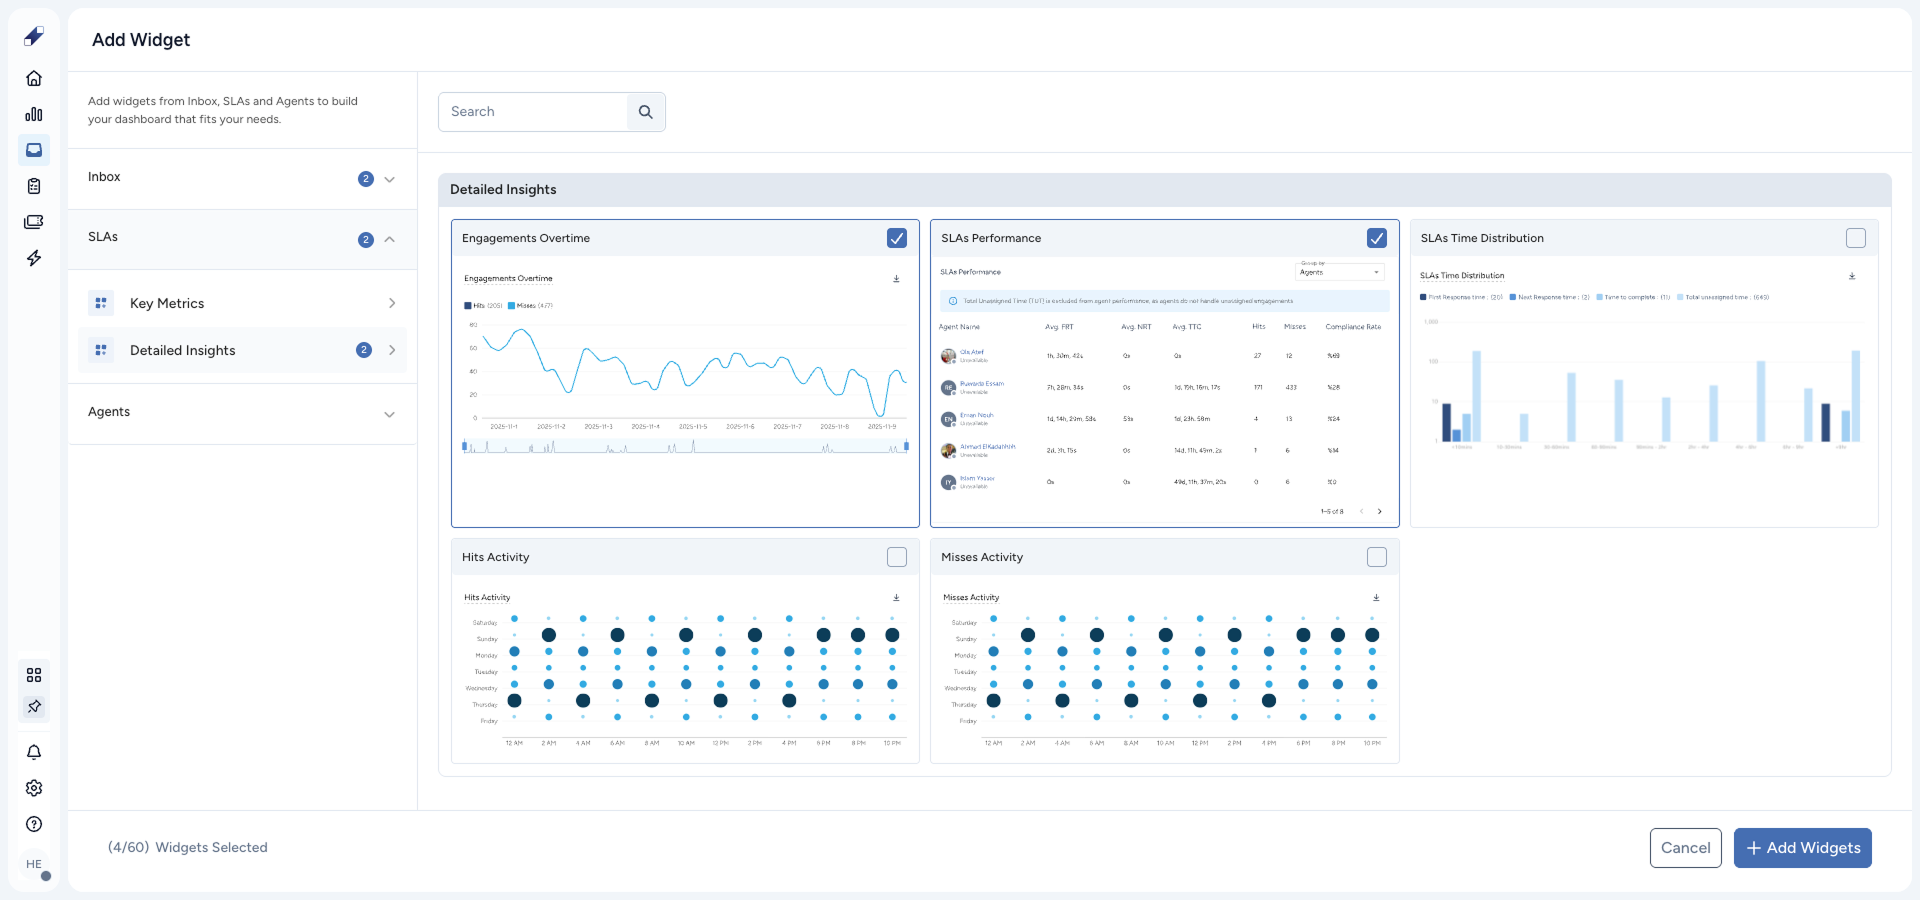
Step 4 – Add Widgets On the dashboard, click Add Widget. The Add Widget panel opens with widgets grouped under three modules:
- Inbox, including Key Metrics and Detailed Insights
- SLAs
- Agents
Select the widgets you want, then click Add Widgets. Each widget is added to the dashboard canvas.
Step 5 – Arrange Your Layout Drag and drop widgets to reorder them, and resize them to fit your layout. Your layout configuration is saved with the dashboard.
Managing Your Dashboard
Apply Filters
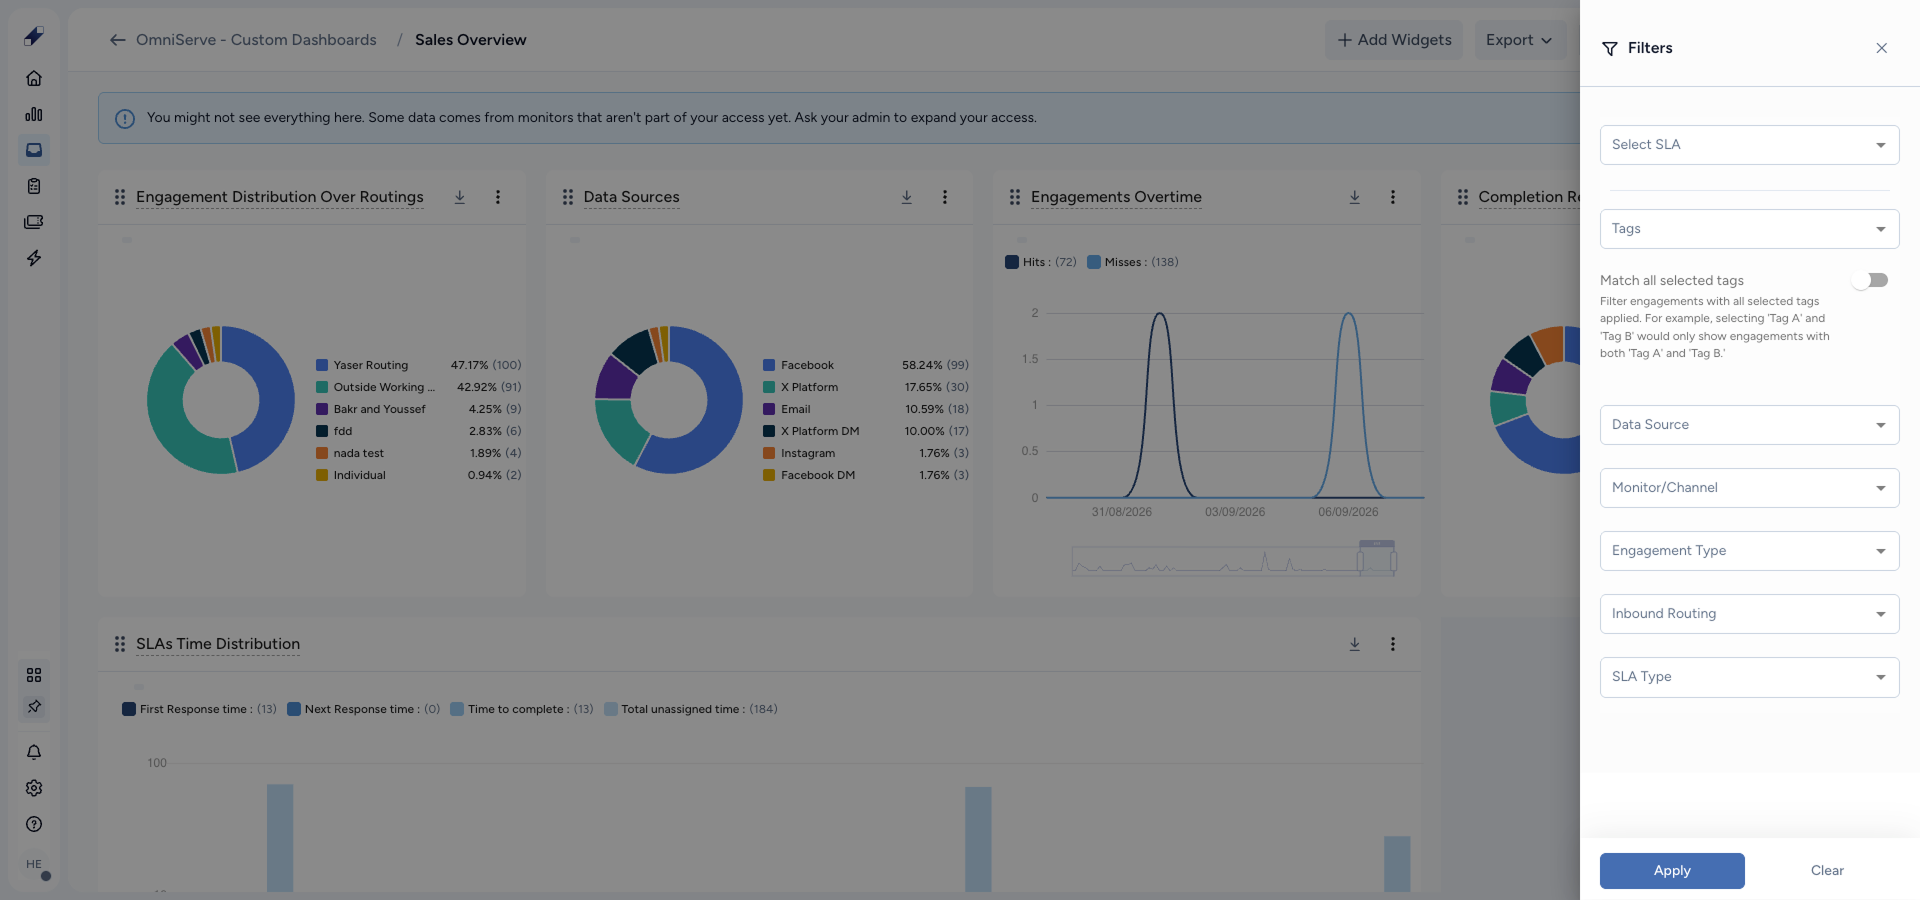
Click Filters to filter all widgets at once. Available filters include:
- SLA and SLA Type
- Agent
- Data Source
- Monitor/Channel
- Engagement Type
- Inbound Routing
- Tags
Click Apply to refresh all widgets with the selected filters, or Save & Apply to keep them for future sessions. Click Clear All to reset the filters and return to the default dashboard scope. You can also change the date range from the date selector at the top of the dashboard.
Edit Widgets
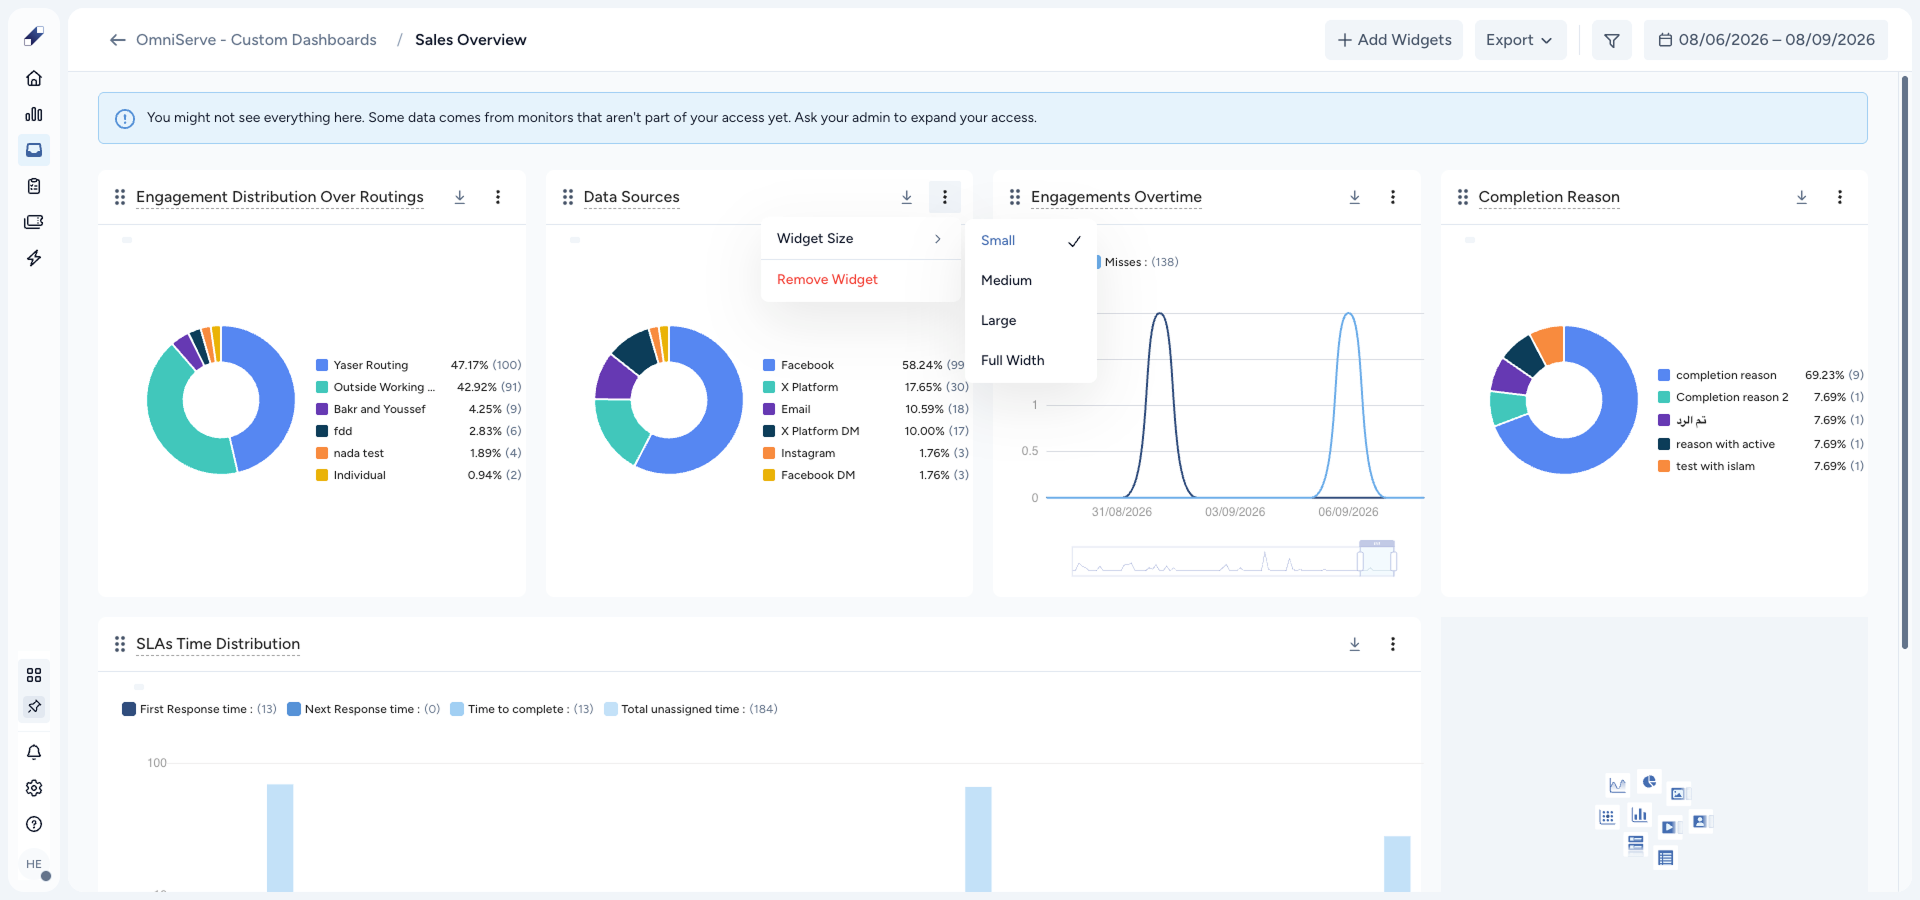
You can add, remove, reorder, and resize widgets at any time. Changes to the layout are saved automatically to the dashboard.
Export Dashboard Data
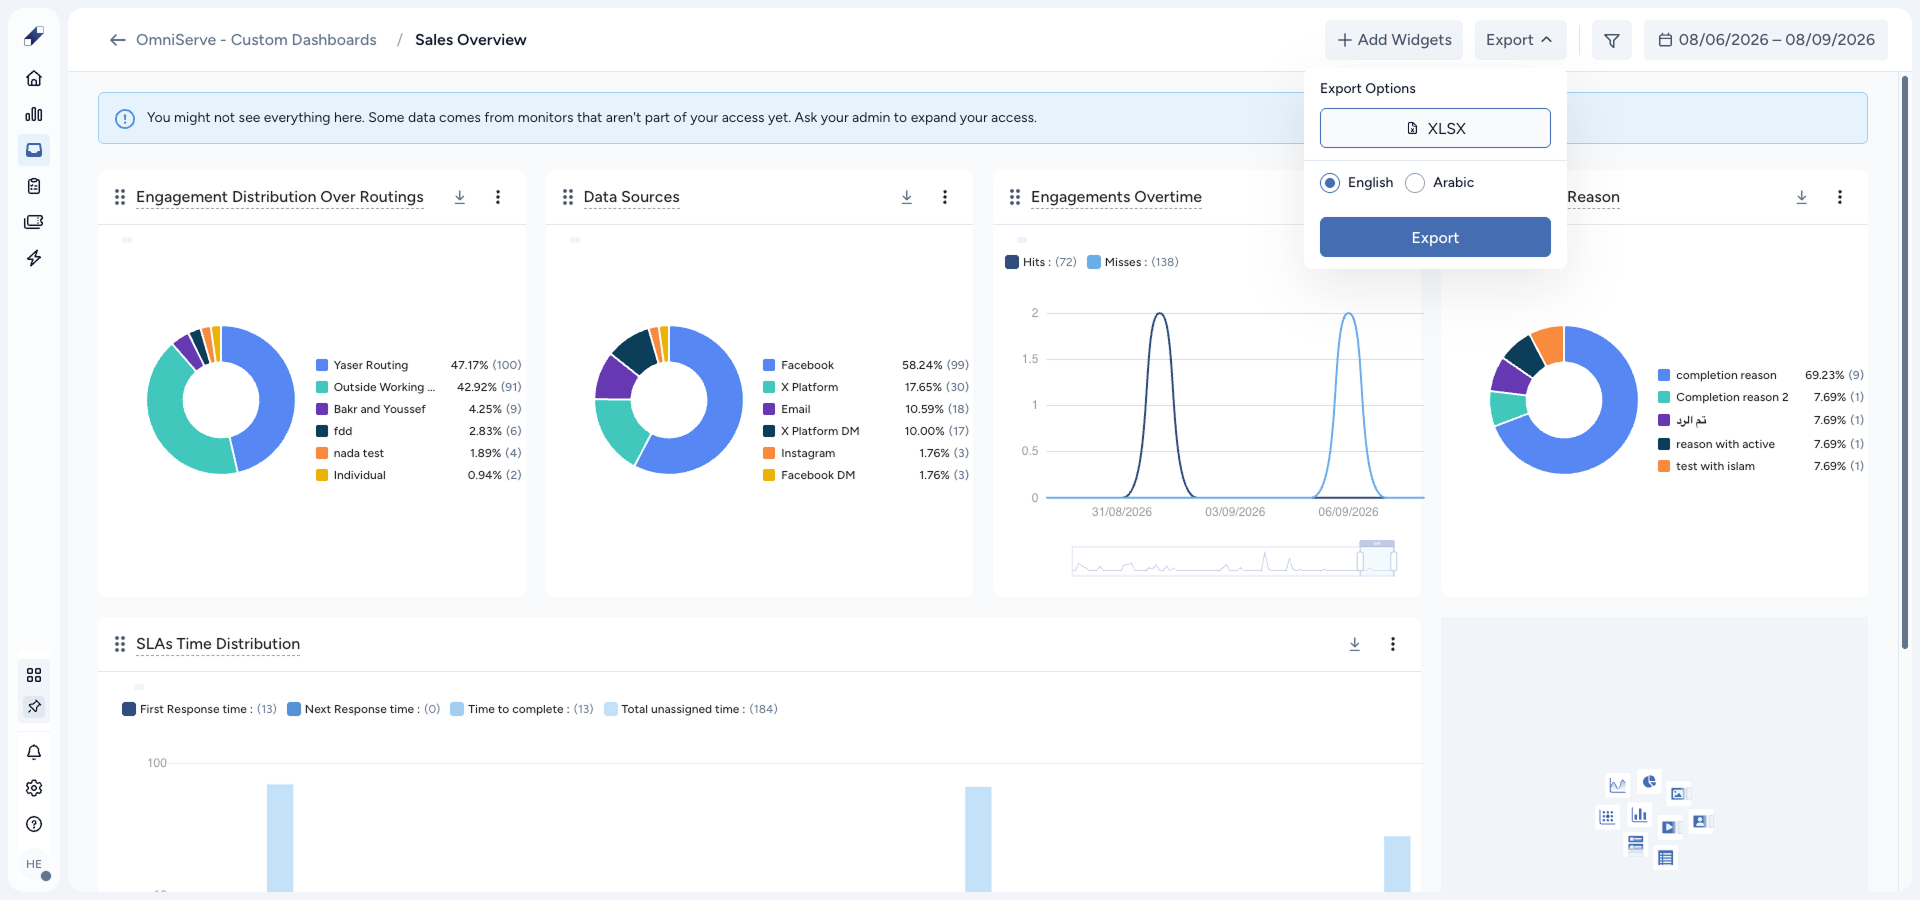
On the dashboard, click Export. Dashboard data is exported as an Excel file.
For further assistance contact Lucidya Support.
الأسئلة الشائعة
The dashboard displays all data within your permission scope by default. You can edit the dashboard later to narrow the data to specific monitors or channels.
No. Agents can only view dashboards that have been shared with them. Dashboard creation is limited to other user roles.
The deleted item is removed from the selection lists and cannot be included in the dashboard. If it was already selected, the system prompts you to review your selection before saving.
You can create 100 or more dashboards, and each dashboard supports 40 or more widgets. The combined limit for monitors and channels per dashboard is 150 selections.